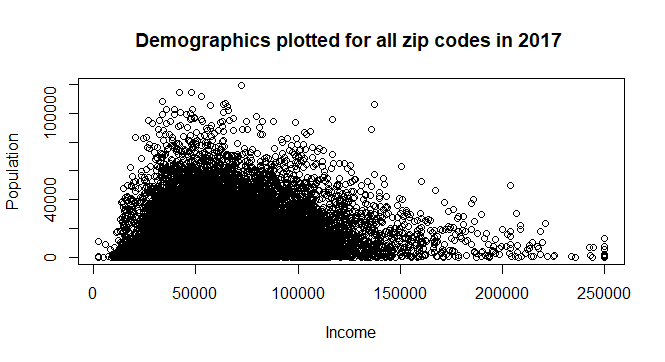
I am trying to understand which direction is the distribution of Median_Income(x) to Total_Population(y) skewed?
My Input:
plot(filterdacsom5$Median_Income,filterdacsom5$Total_Population,xlab="Income",ylab ="Population",main="Demographics plotted for all zip codes in 2017 ",col="red" )
I receive the output as this image:
But is this image plot sufficient to conclude that the distribution of Median_Income(x) to Total_Population(y) left skewed? What other test can be run to prove so?
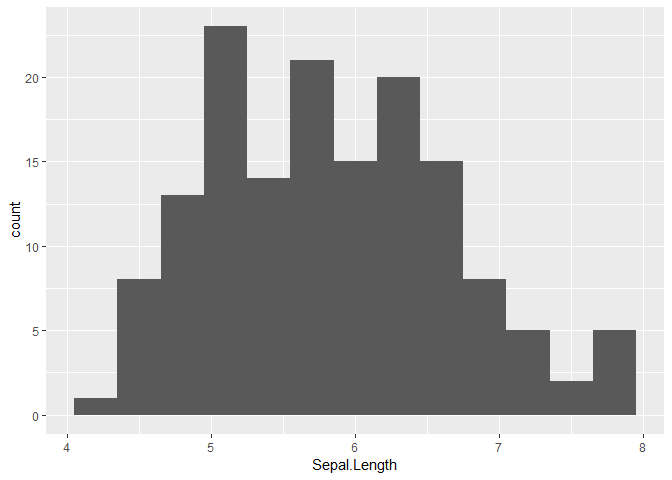
If you are only interested on a measure of skewness, then you can use something like the moments package, I can't use your sample data because is not on a copy/paste friendly format but here is an example with built-in data.
Hi @andresrcs. I understand how to check direction of skewness with one variable(in your example it is sepal length) but since I want measure direction of skewness between 2 variables i.e. Median_Income(x) to Total_Population(y) how would I do that?
Can you please give your example with x(independent variable) and y(dependent variable)?
Sorry but what you are saying doesn't make much sense to me, because skewness is asymmetry in a statistical distribution, in which the curve appears distorted or skewed either to the left or to the right.
But I'm not a statistician so I can't tell for sure if this is a nonsense or not, maybe some one else could help you with this.
As you've been told by pjs (on SO) and Andres before, you'll have to define what is "left" and "right".
In univariate scenario, one defines skewness in terms of the distortion from the distribution from the point of symmetry, how much it is distorted towards left (lower) or right (upper) with respect to the center. You'll have to define what do you consider as the center.
There're existing papers on multivariate skewness, mainly for multivariate normal. You may go through the following paper:
Having said that, I think you're interested in the "skewness" of the independent variable with respect to the independent variable. I'm not sure whether it makes sense to comment on this from the scatterplot or not. You may want to find the conditional distribution first.