I currently am able to hit the Rstudio connect api and access data for average session time. However, how can I get data for since June or the last 60 days, it has been used a total of X number of times? I only want to see number of sessions and not duration of sessions
My code -
## ACTION REQUIRED: Change the server URL below to your server's URL
Sys.setenv("CONNECT_SERVER" = "https://rstudio.xx.com/")
## ACTION REQUIRED: Make sure to have your API key ready
Sys.setenv("CONNECT_API_KEY" = rstudioapi::askForPassword("Enter Connect Token:Uxx"))
library(ggplot2)
library(dplyr)
library(connectapi)
library(purrr)
client <- connect()
# Get and clean the Shiny usage data
shiny_rsc <- get_usage_shiny(
client,
from = lubridate::today() - lubridate::ddays(7),
limit = Inf
) %>%
filter(!is.na(ended)) %>%
mutate(session_duration = ended - started)
glimpse(shiny_rsc)
# Get the title of each Shiny app
shiny_rsc_titles <- shiny_rsc %>%
count(content_guid) %>%
pull(content_guid) %>%
purrr::map_dfr(
~tibble(content_guid = .x, content_name = content_title(client, .x))
)
glimpse(shiny_rsc_titles)
# Calculate the average session duration and sort
app_sessions <- shiny_rsc %>%
group_by(content_guid) %>%
summarise(avg_session = mean(session_duration)) %>%
ungroup() %>%
arrange(desc(avg_session)) %>%
head(10) %>%
inner_join(shiny_rsc_titles, by = "content_guid")
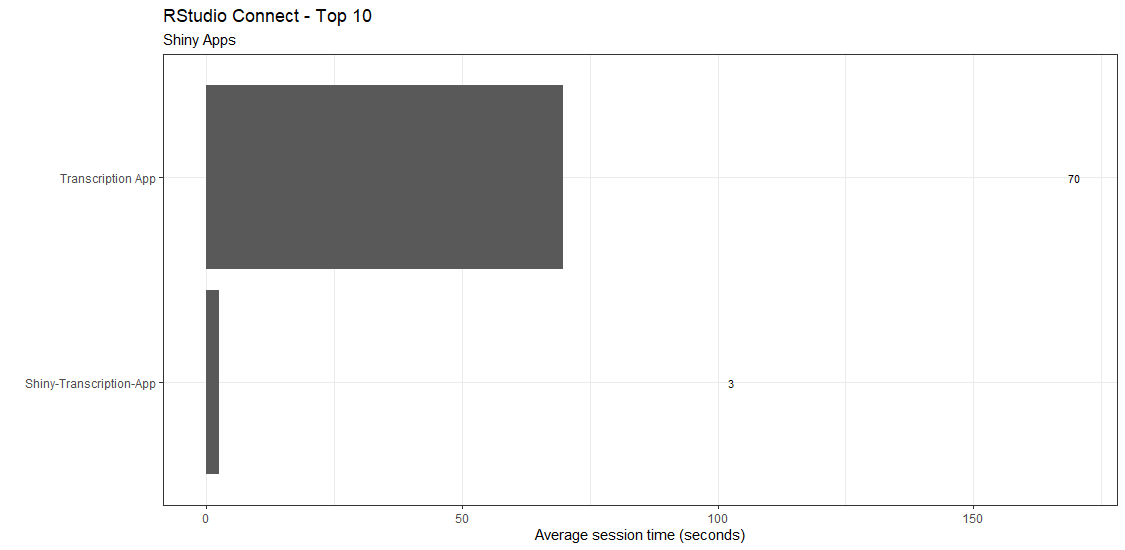
# Plot the top 10 used content
app_sessions %>%
ggplot(aes(content_name, avg_session)) +
geom_col() +
scale_y_continuous() +
geom_text(aes(y = (avg_session + 100), label = round(avg_session)), size = 3) +
coord_flip() +
theme_bw() +
labs(
title = "RStudio Connect - Top 10",
subtitle = "Shiny Apps",
x = "",
y = "Average session time (seconds)"
)
So as you see the viz is that of top 10 apps but by average session and not by number of times it has been used in total. How can I access that data?