Could someone please help me advise how I can combine my data below into a bar graph? I am afraid I am still working on fixing my reprex situation, I installed it I just cant figure out how to use it. It is not very clear to me how I use it, even after watching Jenny Bryan.
I want to show women and men in bars illustrating their median sleep.
I managed to create a summary but I am struggling on how to combine the two frames into a bar graph?
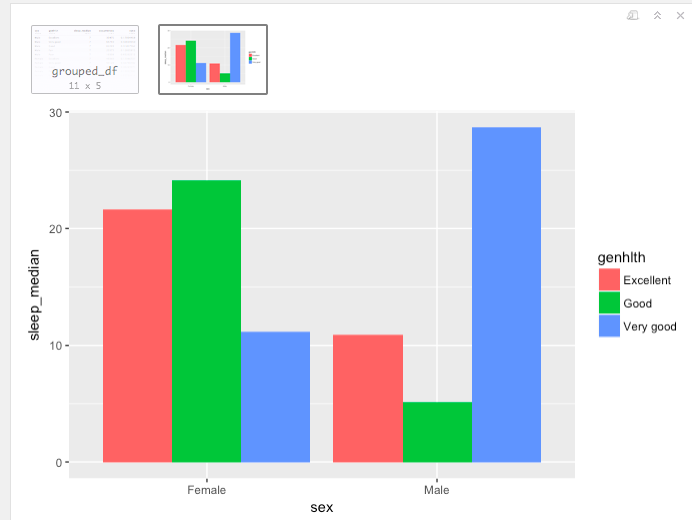
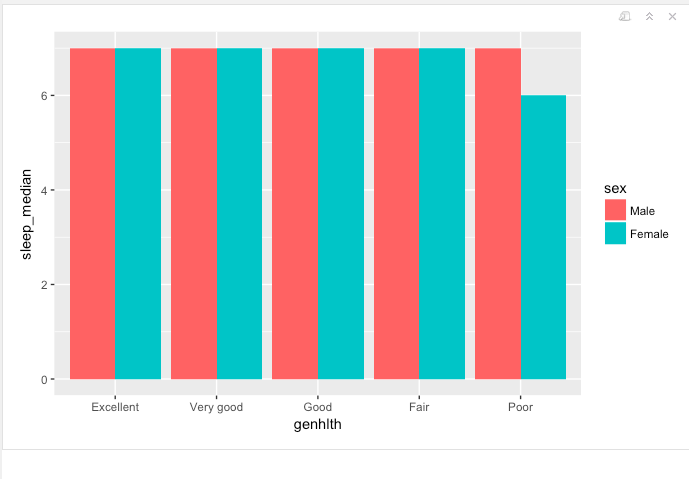
I want men's median sleep and women's beside each other for each health category. (not the ratio, just median)
So it looks like you're taking tidy data (one variable per column, in this case, sleep_cleaned$sex) and ~ untidying it when you put the pieces back together (rather than having a data frame with sex, genhlth, sleep_median, and ratio, you have the median and ratio variables given twice, one for women and one for men).
What I think you want to be doing is grouping by multiple variables (the link below is to R4DS 5.6.5 Grouping by multiple variables):
Once you do that, you'll be able to do the kind of grouped bar chart you're describing (you can look at the code in the R graph gallery):
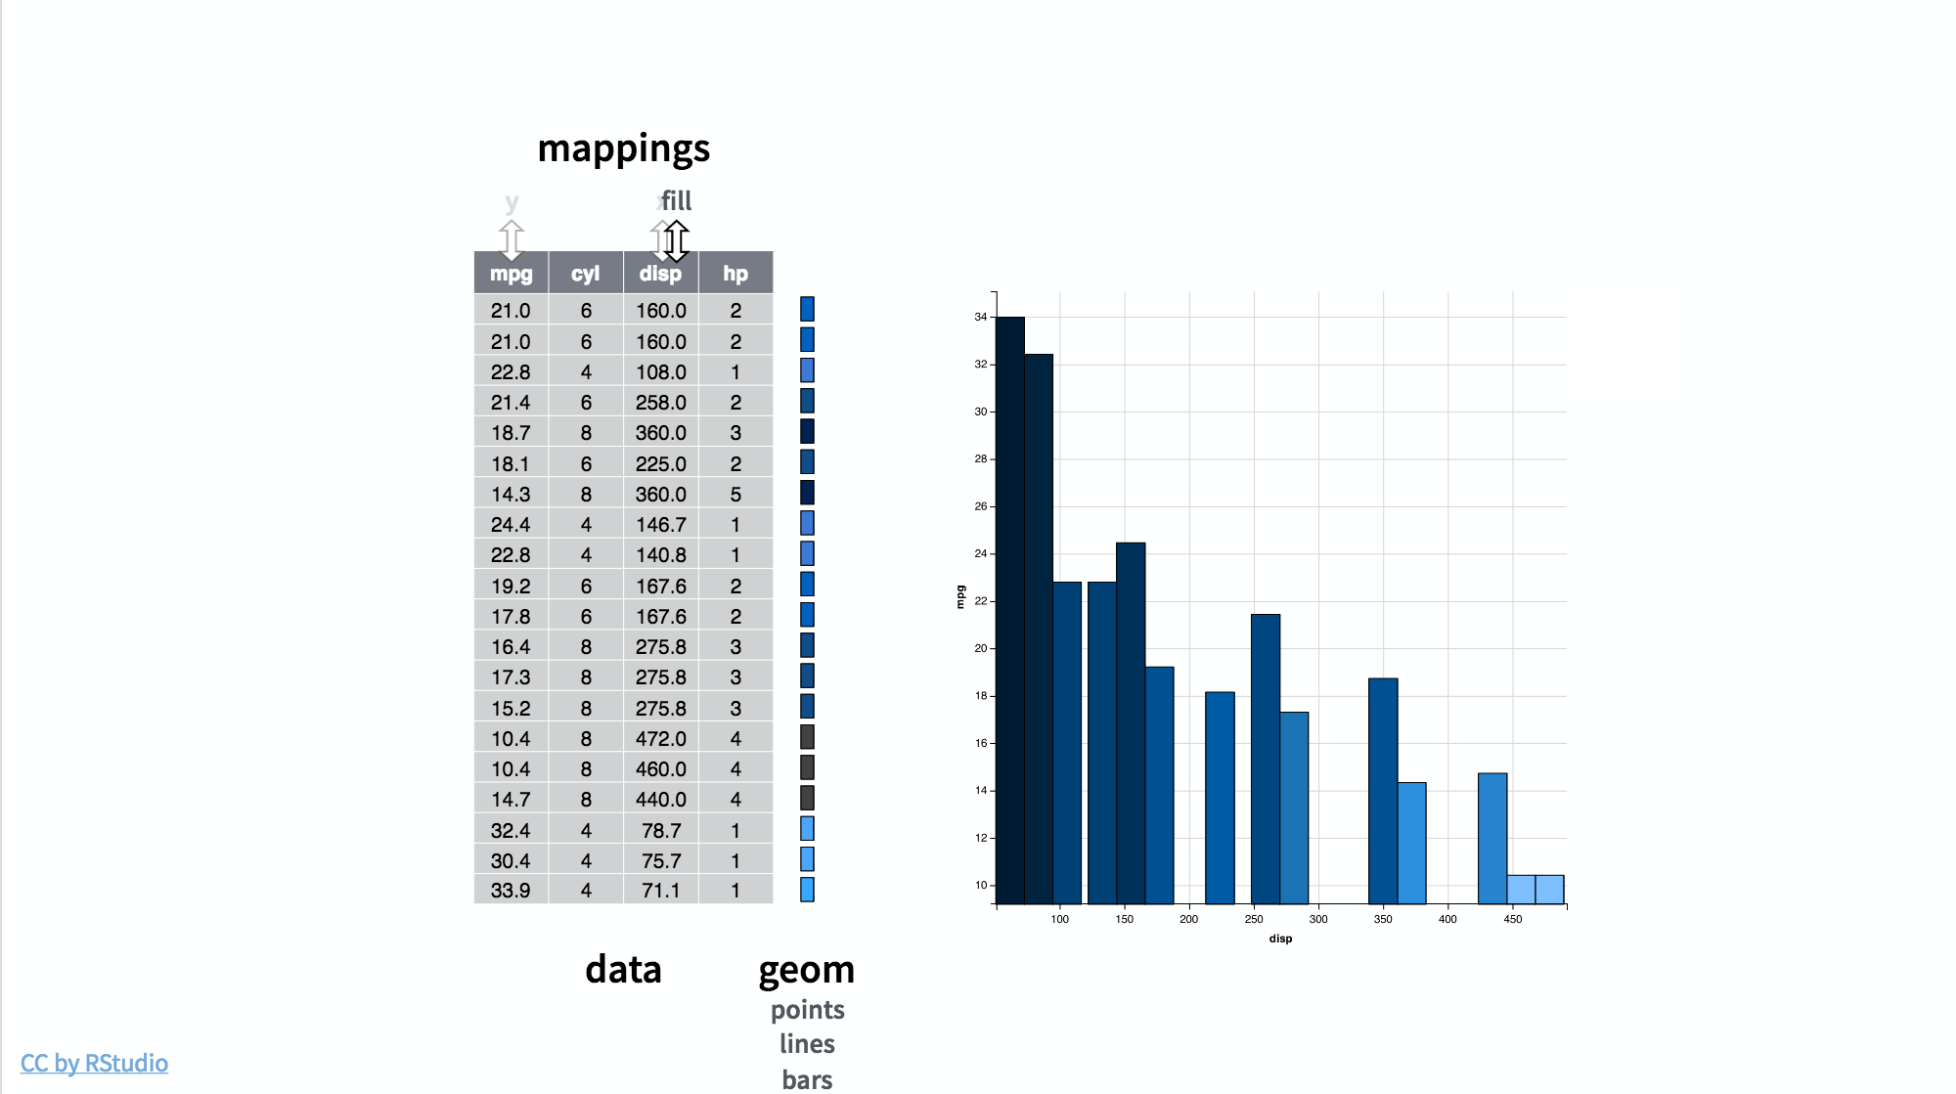
You can also see the Position adjustment section of R4DS, which describes how ggplot2 maps the variables to the aesthetics to make the grouping.
The core assumption with graphs, that violating means a lot more work in making a graph, is that each column is controlling an aspect of the graph. In this case, the easiest path is to have a column indicating gender (as that controls how many bars you have) and a column with the mean height (as that controls the height of each bar).
You can also get a single ratio variable in by regrouping to the level of the group you want the ratio of (making a bigger venn diagram circle)
Hello, thank you so much but I get an error...
Error: Incomplete expression: all_sleep <- sleep_cleaned >
filter(!is.na(sleptim1),!is.na(genhlth)) >
group_by(sex, genhlth) >
summarise(sleep_median =median(sleptim1), occurrences= n()) >
group_by(sex) >
mutate(ratio = occurrences / sum (occurrences)
Thank you Mara, I am afraid the instructions are not simple enough for me, I do not get what I need to do.
I will go back to it after I learn some more R:)
Looking back I see I missed a final parentheses closure ) in my copy and paste.
If it was some other form of error, I was writing the example code on the assumption, from how I read your code, that in sleep_cleaned sleptim1 is a numeric variable (so you can calculate the mean) and sex and genhlth are variables you can categorise your data from. So if one of those assumptions was wrong, it could be generating errors.
Thank you thoughtfulnz,
I had a few painful visual experiences trying to create a graph,I think I should enter a worst of graph's trials contest.
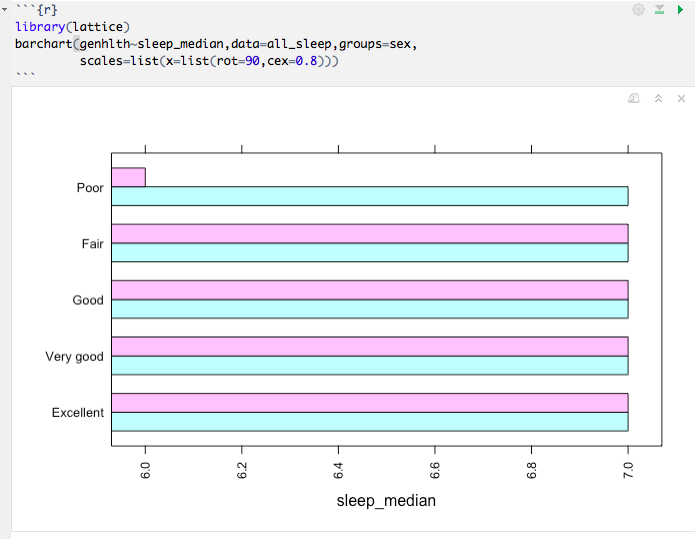
However, I did manage to get one graph, but the problem is that when I try to include more values then 3 I get an error, I also want "Poor" and "Fair".
Secondly, the graph does not show the median, how do make it do what I want?
I figured it out but would a more fancy solution would be very welcomed.
Pastel is not my style. But more importantly it does not start from 1 and with the decimals the data is not well represented.
Hi Mara,
I am looking for the median below. I would be very happy to learn what I am doing wrong in the graph I tried to create.
When I try to add "Fair" I get the following error.
Error:Error in data.frame(sex, genhlth, sleep_median) : arguments imply differing number of rows: 6, 16, 12
I am not sure what the figures 3, 4 are for? The calculations are based on them it seems but I can not figure out how.
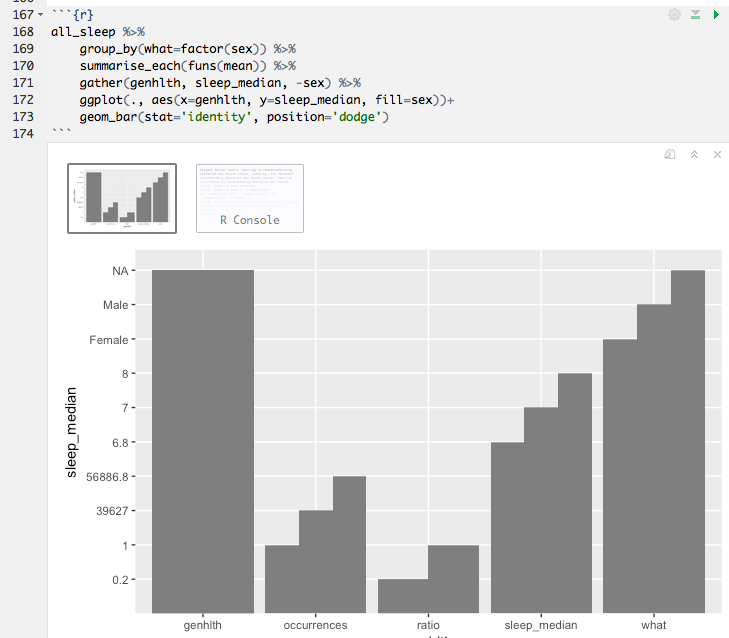
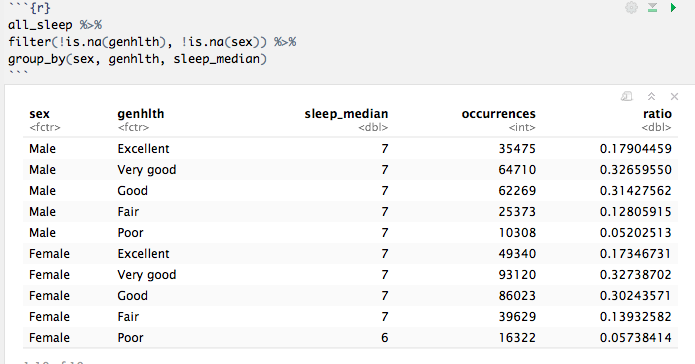
You're creating the output in the shot below (in R Markdown or in an R Notebook, depending on which you're running), but you aren't actually saving that data frame you see. This is not a bad thing. One option is to use another pipe (%>%) and go straight to ggplot(...) from there (though be sure to switch to the + operator for the various ggplot layers, e.g. ⇩)
data %>%
  filter(!is_na(var1)) %>%
  group_by(var2, var3) %>%
  ggplot(aes(x = var2, y = var1, fill = var3)) +
    geom_bar(position = "dodge", stat = "identity")
Since you're using markdown already, would it be possible to post this as a gist if you're not sure how to reprex yet?