How did they get to Carnegie Hall?
Authors: Nathan Day, Kurtis Pivert
Working with Shiny more than 1 year
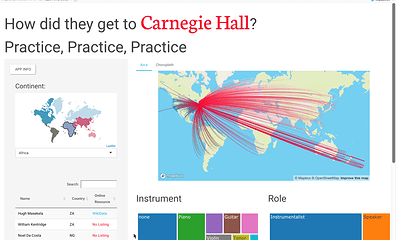
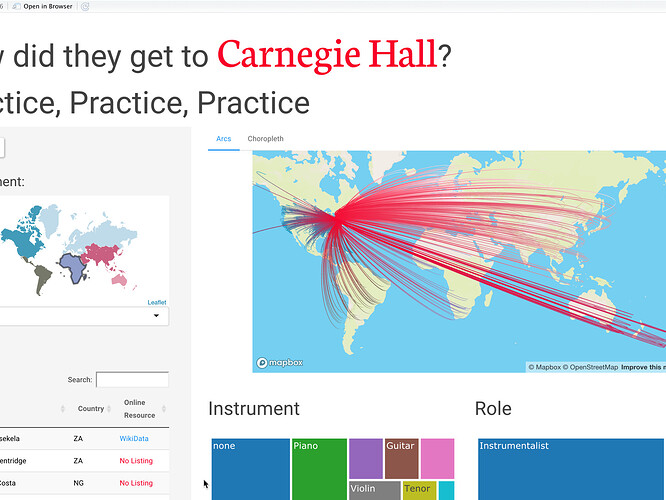
Abstract: “How do you get to Carnegie Hall?” Musicians would tell you it isn’t a cab to 57th and 7th but “Practice, Practice, Practice.” This Shiny dashboard demonstrates how far each the >8000 individual performers traveled in order to grace the stage at Carnegie Hall in New York. Using data from the Carnegie Hall Database, users can explore performers by their continent of birth, search the table to find a specific performer and learn more about their journey through available resources.
Full Description: This Shiny dashboard uses an interactive plotly map to filter data on >8000 musicians, conductors, singers, dancers, and even ventriloquists who have performed at New York’s Carnegie Hall over its 129-year history. The application uses the mapdeck package to harness the power of the deck.gl JavaScript library for developing stunning interactive GIS visualizations.
Category: Other
Keywords: GIS, deck.gl, music, mapdeck, plotly, DT
Shiny app: https://kpivert.shinyapps.io/Carnegie-Hall-App/
Repo: GitHub - kpivert/Carnegie-Hall-App: How did they get to Carnegie Hall? 2020 Shiny Contest Submission
RStudio Cloud: Posit Cloud
Thumbnail:
Full image:

