org_dat = tibble( dat = sample( LETTERS[1:4], 100, replace = TRUE ) ,
num = sample( 1:100 , replace = TRUE ) )
subsetting <- function(data, col, var) {
data %>%
filter({{col}} == var) %>%
group_by({{col}}) %>%
summarise(MEAN_SUM = sum(num))
}
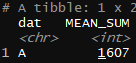
subsetting(data = org_dat, col = dat, var = 'A')
Working with dplyr functions can be tricky due to tidy evaluation. Learn more about it here. dplyr functions expect to see unquoted variable names (literally without quotations), so if you want your functions work with dplyr functions, you need to pass it unquoted variable names. To do this, you need to use the special "embrace" operator {{ }} to do some quoting/unquoting magic.
If your question's been answered (even by you!), would you mind choosing a solution? It helps other people see which questions still need help, or find solutions if they have similar problems. Here’s how to do it: