I used this code to create a plot:
ggplot(avg_monthly_2020) +
  geom_col(aes(x=month,y=mean_time,fill = customer_type)) +
  scale_x_discrete(limit=c("1","2","3","4","5","6","7","8","9","10","11","12"),
                   labels=c("Jan","Feb","Mar","Apr","May","June","July","Aug","Sep","Oct","Nov","Dec"))+
  scale_y_continuous(limit=c(0.0,180.0),breaks = c(0,20,40,60,80,100,120,140,160,180))+
  labs(title="Average Traveling Time Per Month",
       subtitle = "Record of average traveling time by 2 groups of customer each month",
       caption = "Data collected by Cyclistic from January 2020 to December 2020",
       y = "Average Time (Minutes)",x= "Month") +
  theme(title=title_style,
        plot.subtitle = subtitle_style,
        plot.caption = caption_style,
        legend.position = "top",
        legend.title = element_blank(),
        axis.title=axis_style)
It produced this plot :
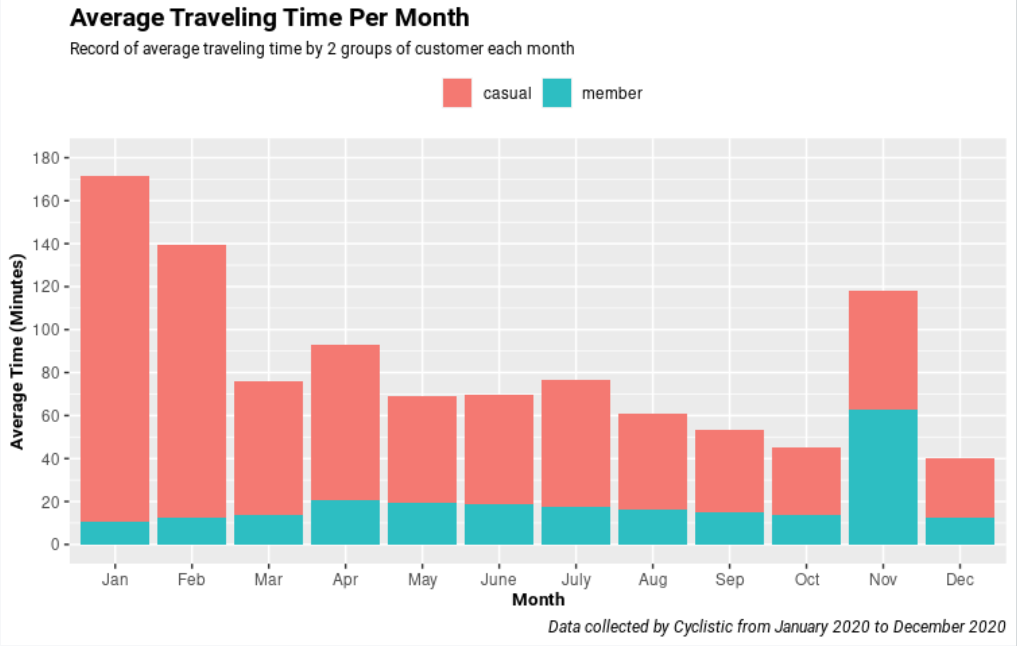
How do separate "customer" and "member" into 2 columns for the same month?
Thank you