How can I set the right font of heatmap?Continuted.

Continuing the discussion from How can I set the right font of heatmap to be italic?And some font to be superscripts or subscript below heatmap?:

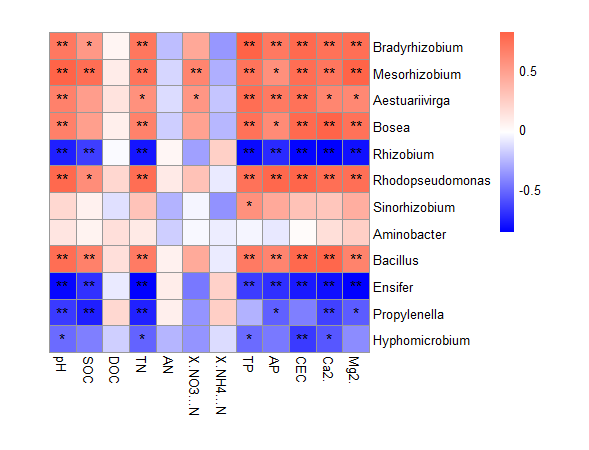
Thanks!But there are some problem.Fig.1 is prime.So how can I make the code?

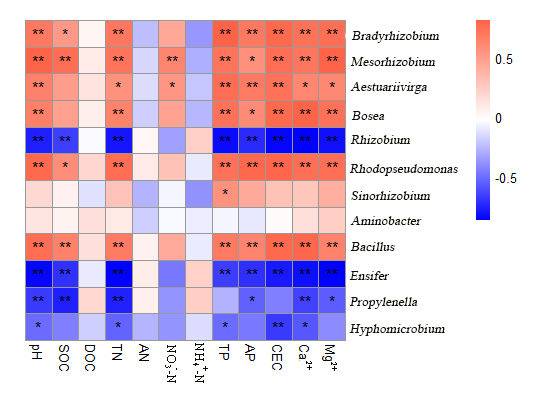
(NO3-)-N is Nitrate Nitrogen and it should be the right font.3 should be subscript ,- after 3 should be superscript.
(NH4+)-N is Ammonium nitrogen and it should be the right font.4 should be subscript ,+ after 4 should be superscript.
Ga2+/Mg2+ The 2+ should be superscript.
The right font of heatmap should be italic.

setwd(choose.dir())

options(repos=structure(c(CRAN="The Comprehensive R Archive Network")))
install.packages('psych')
install.packages("reshape2")
library(psych)
library(corrplot)
library(pheatmap)
library(reshape2)

Order<-read.table('nirk_属水平.txt', header = TRUE,
sep = '\t',row.names = 1)

Order<-t(Order)

lihua<-read.table('env_table.txt', header = TRUE,
sep = '\t',row.names = 1)

res<-corr.test(Order, lihua, method = 'spearman',
adjust = 'holm',alpha = 0.05)
rmt<-res$r
pmt<-res$p
mycol<-colorRampPalette(c("blue","white","tomato"))(800)

if (!is.null(pmt)){ssmt <- pmt< 0.01
pmt[ssmt] <-'**'
smt <- pmt >0.01& pmt <0.05
pmt[smt] <- '*'
pmt[!ssmt&!smt]<- ''
} else {
pmt <- F
}

pheatmap(rmt, cluster_rows = F, cluster_cols = F,
display_numbers = pmt,fontsize_number = 12,
number_color = "black", cellwidth = 20,
cellheight = 20,color = mycol)

nirk_属水平-1

  1. What software or programming language are you using to create the heatmap? (e.g., Python with matplotlib, R with pheatmap, seaborn, etc.)

I use R with pheatmap

I don't understand what you mean.

So, you can create a new vector that contains expressions using the plotmath formulation.

Instead of "(NO3-)", you can write expression(NO[3]^"-"), instead of "(NH4+)" you can write NH[4]^"+" etc. Then you can pass it as the labels_col = argument of pheatmap() to overwrite the original labels.

Similarly, you can replace the column labels with the argument labels_row = , using expression(italic(Bradyrhizobium)) etc.

To computationally recode the row labels (without retyping by hand), this should work (note, this is advanced R, it's hard to understand why it works):

new_row_labels <- paste0("italic(", colnames(rmt), ")")
new_row_labels <- as.expression(sapply(new_row_labels, str2lang))

I can't think of any easy way to computationally create the column labels, as R can't guess where you want the subscripts and superscripts, I think you have to retype it yourself. Once you have created these vectors new_row_labels and new_col_labels, you can pass them in your pheatmap() call, something like that:

pheatmap(rmt,
labels_row = new_row_labels, labels_col = new_col_labels,
cluster_rows = F, cluster_cols = F,
display_numbers = pmt,fontsize_number = 12,
number_color = "black", cellwidth = 20,
cellheight = 20,color = mycol)

I can't directly give you the code for your data, as I don't have the original datasets, you didn't give us a reproducible example.

Here the final picture.
nirk_属水平-4

So, looks like it all works as you want?

I made the final picture with photoshop after the prime one.Here the data in my code.Could you help me made the final picture with R?

nirk_属水平:

A1 A2 A3 A4 A5 A6 A7 A8 B1 B2 B3 B4 B5 B6 B7 B8
Bradyrhizobium 28.63 16.29 14.73 24.59 37.61 39.89 46.68 49.43 1.00 0.73 0.81 1.16 0.50 1.06 1.32 1.40
Mesorhizobium 31.00 30.51 16.53 17.14 12.71 8.53 24.30 20.19 1.07 0.63 0.63 0.93 0.48 1.14 0.90 0.74
Aestuariivirga 3.92 5.55 16.69 16.81 18.66 5.57 2.79 5.84 0.13 0.11 0.27 0.34 0.34 0.30 0.30 0.46
Bosea 3.54 6.91 8.49 5.91 11.12 7.90 10.94 3.82 1.67 1.08 1.26 1.73 1.22 1.60 2.82 1.97
Rhizobium 4.64 9.05 4.20 14.44 2.22 2.34 0.69 3.87 20.62 21.06 29.03 26.21 25.59 30.19 38.02 27.25
Rhodopseudomonas 0.82 0.26 0.63 2.03 1.27 16.93 0.37 1.85 0.01 0.02 0.03 0.01 0.02 0.04 0.03 0.01
Sinorhizobium 3.24 0.04 0.00 0.00 0.97 0.44 1.52 1.69 0.03 0.01 0.03 0.00 0.09 0.12 0.07 0.01
Aminobacter 0.96 5.35 0.25 0.00 0.12 0.26 0.39 0.08 0.41 0.10 0.32 0.13 0.03 0.41 0.24 0.36
Bacillus 0.25 0.38 1.69 0.81 0.81 0.83 0.35 0.56 0.30 0.13 0.01 0.01 0.02 0.02 0.00 0.16
Ensifer 0.35 0.51 0.73 0.63 1.04 0.38 0.30 0.61 5.92 11.80 7.72 9.24 11.02 9.74 8.70 10.34
Propylenella 0.02 0.08 0.02 0.12 0.93 0.03 0.05 0.08 0.02 0.29 0.11 0.47 0.33 1.37 0.47 0.74
Hyphomicrobium 0.57 0.07 0.00 0.00 0.00 0.06 0.12 0.00 0.15 0.16 0.19 0.44 0.12 0.48 0.42 0.31

env_table:

pH SOC DOC TN AN NO3--N NH4+-N TP AP CEC Ca2+ Mg2+
A1 7.50 15.42 0.23 1.90 55.49 39.30 11.55 0.32 30.53 6.51 4.83 0.26
A2 7.26 14.43 1.06 1.71 91.43 54.29 72.41 0.21 12.82 6.47 4.73 0.24
A3 7.39 14.79 0.21 1.91 56.43 45.64 13.61 0.15 27.76 6.97 5.02 0.23
A4 7.57 14.52 0.70 1.84 98.89 49.96 67.82 0.18 20.09 7.30 4.63 0.23
A5 7.09 13.27 0.90 1.69 91.48 25.76 46.50 0.33 24.14 7.87 4.89 0.24
A6 7.38 13.48 0.56 1.91 83.96 16.43 32.20 0.21 42.38 6.86 5.08 0.24
A7 7.50 14.11 0.24 1.97 64.58 36.44 13.76 0.24 23.47 8.34 4.96 0.24
A8 7.31 14.48 0.25 1.91 69.03 40.79 13.81 0.26 33.73 6.98 4.64 0.23
B1 5.01 13.78 0.38 1.68 93.25 25.99 46.67 0.08 13.05 4.14 2.43 0.21
B2 4.90 14.05 0.32 1.57 92.57 22.87 55.18 0.14 7.60 3.97 2.44 0.22
B3 6.23 12.07 1.65 1.72 158.05 8.83 218.60 0.07 15.99 4.58 2.41 0.22
B4 4.82 12.59 0.38 1.67 78.57 27.49 30.56 0.08 15.89 3.92 2.30 0.21
B5 4.78 10.19 0.21 1.52 65.33 30.25 17.63 0.13 14.60 3.55 1.87 0.15
B6 4.88 10.01 0.44 1.55 71.60 9.61 22.21 0.11 12.88 4.05 2.20 0.17
B7 4.74 11.14 0.17 1.36 56.47 31.77 15.76 0.12 11.60 2.84 2.34 0.20
B8 4.80 9.74 0.26 1.17 53.53 29.02 14.77 0.13 12.59 3.58 2.08 0.16

The picture of env_table data:

This topic was automatically closed 42 days after the last reply. New replies are no longer allowed.

If you have a query related to it or one of the replies, start a new topic and refer back with a link.