Drug1 = a dataframe of drug concentration (V2) and measured response (response)
| response | V2 |
|---|---|
| 102.5303783 | 1896 |
| 102.5050507 | 948.2 |
| 100.3063443 | 474.1 |
| 100.2961096 | 237.1 |
| 89.3452755 | 118.5 |
| 38.90199925 | 59.26 |
| 15.41198625 | 29.63 |
| 10.33549066 | 14.22 |
| 10.96631549 | 7.112 |
| 2.669522625 | 3.556 |
| -0.597990565 | 1.778 |
| -7.09484506 | 0.8297 |
Using the tidydrc package, I fit an LL.4 model:
drug1.LL4 <- tidydrc_model(drug1, V2, response, model = LL.4())
I plot the curve - looks perfect :
tidydrc_plot(drug1.LL4,ed50=FALSE) + scale_x_log10()
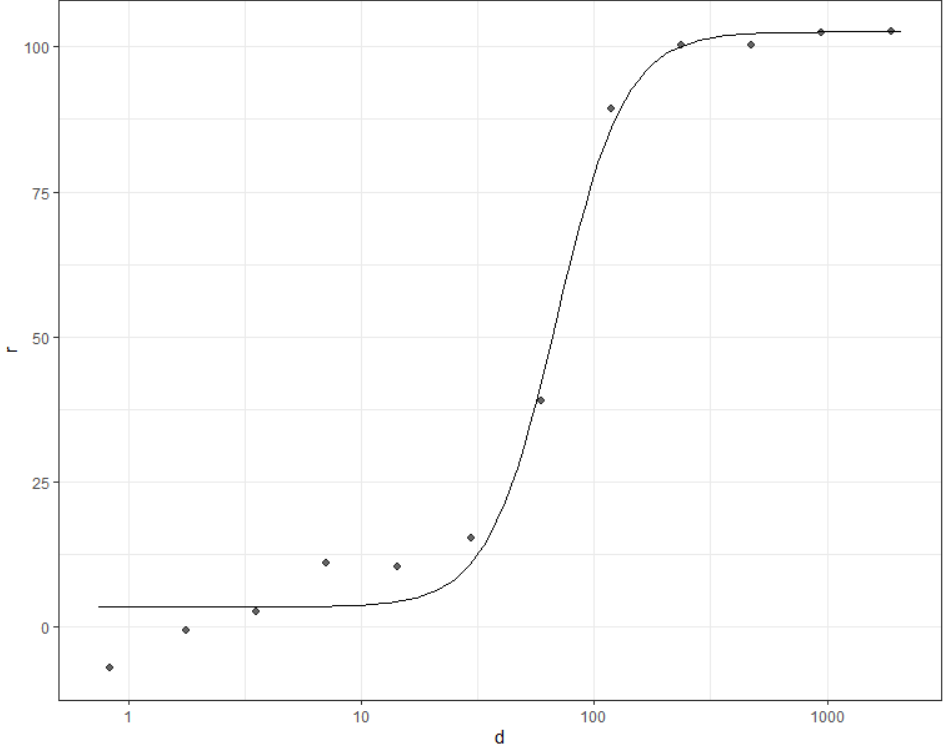
Each point is the mean. I want to add error bars (standard error of mean) based on my four replicates. I go back to a different dataset containing four replicates, and follow this tutorial I found to calculate standardard error . My result is a dataframe called tgc2:
| variable | N | value | sd | se | ci |
|---|---|---|---|---|---|
| 0.8297 | 4 | -7.09484506 | 2.350358363 | 1.175179181 | 3.739944644 |
| 1.778 | 4 | -0.597990565 | 5.320693227 | 2.660346613 | 8.466410251 |
| 3.556 | 4 | 2.669522625 | 7.608666393 | 3.804333196 | 12.10708612 |
| 7.112 | 4 | 10.96631549 | 11.38786336 | 5.69393168 | 18.12063184 |
| 14.22 | 4 | 10.33549066 | 0.737991633 | 0.368995816 | 1.174309372 |
| 29.63 | 4 | 15.41198625 | 1.218442351 | 0.609221175 | 1.938813679 |
| 59.26 | 4 | 38.90199925 | 1.443234999 | 0.7216175 | 2.296508946 |
| 118.5 | 4 | 89.3452755 | 2.284661761 | 1.14233088 | 3.635406689 |
| 237.1 | 4 | 100.2961096 | 0.182323318 | 0.091161659 | 0.290117085 |
| 474.1 | 4 | 100.3063443 | 2.232914056 | 1.116457028 | 3.553064543 |
| 948.2 | 4 | 102.5050507 | 0.042179293 | 0.021089646 | 0.067116667 |
| 1896 | 4 | 102.5303783 | 0.065724222 | 0.032862111 | 0.104581904 |
Now I try to go back and add the error bars to the original data plot, by doing this :
tidydrc_plot(drug1.LL4,ed50=FALSE) + scale_x_log10() + geom_errorbar(aes(ymin=tgc2$value-tgc2$se, ymax=tgc2$value+tgc2$se, x=drug1.LL4[[1]][[1]]$d, y=drug1.LL4[[1]][[1]]$r))
However, what I get is this :
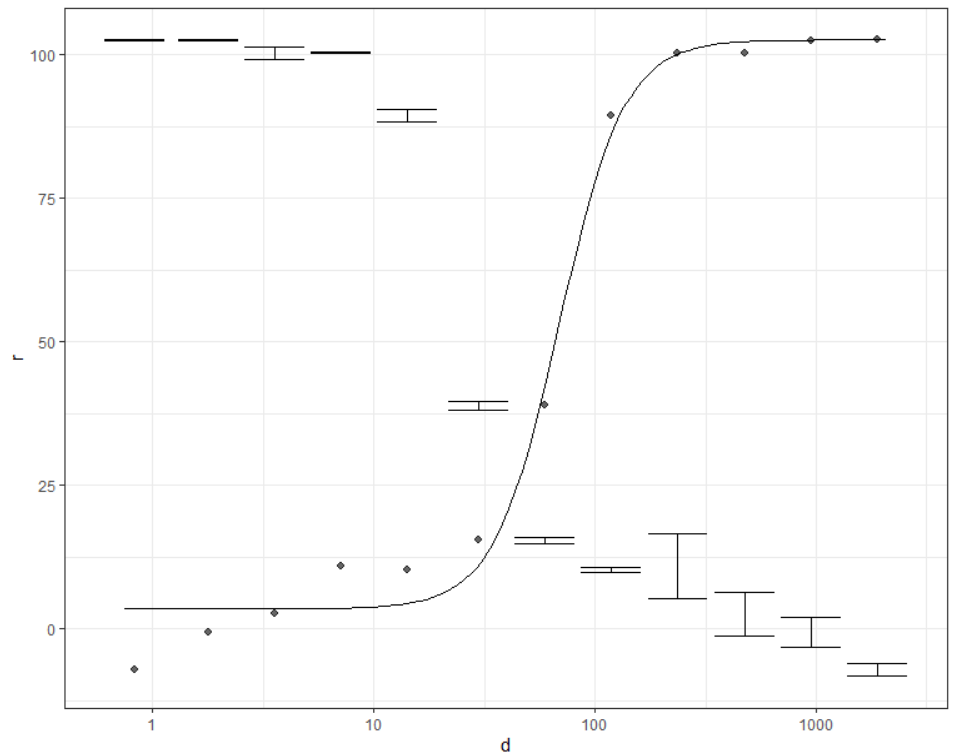
You can see that the y-position of the error bars is exactly correct. But the x-position is not.
How can I fix this?