Hi,
I'm using the decompose function and I want to show the months in the xlabel of the plot. For example: January, February, March and so on. How can I do that?
Any help? It would be really great .
Hi,
I'm using the decompose function and I want to show the months in the xlabel of the plot. For example: January, February, March and so on. How can I do that?
Any help? It would be really great .
I tried to fo the same and didn't arrive at my desire.
perhaps share some plotting code to show what you do with the decompose result ?
This does not look like base plotting, it looks like some ggplot2 ... right ?
The feasts package produces a plot that might be more what you want.
library(feasts)
library(ggplot2)

USAccDeaths %>%
  as_tsibble() %>%
  model(STL(value)) %>%
  components() %>%
  autoplot() + labs(x="Month")
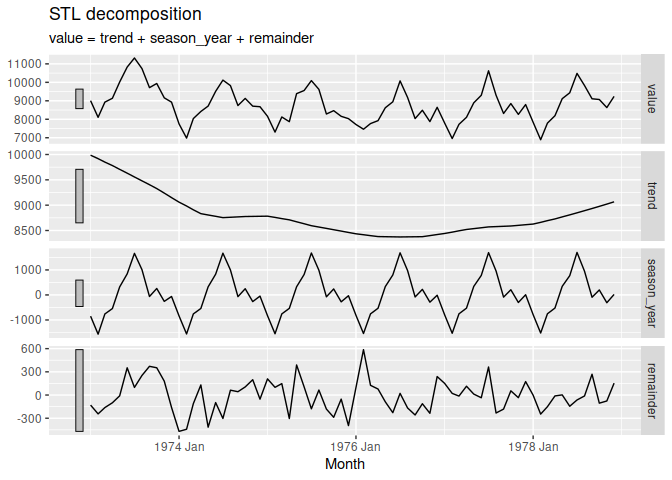
Created on 2020-12-25 by the reprex package (v0.3.0)
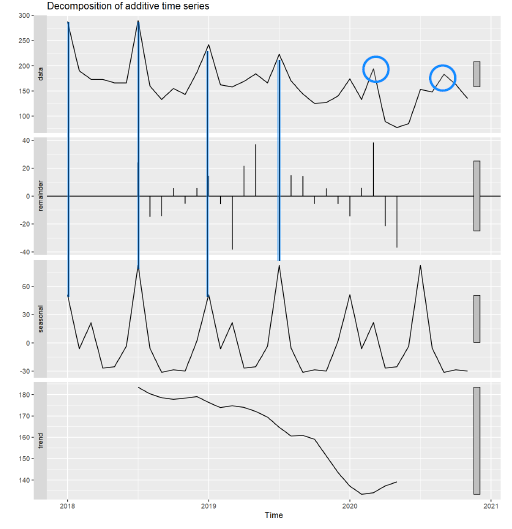
Yes, you're right. Here is the code.
if(!require("astsa")) install.packages("astsa")
require(astsa)
library(readxl)
library(ggplot2)
rotac<-x[c(1:35),c(1:2)]
rot <-ts(rotac[[2]], start = c(2018,1), end = c(2020,11), frequency = 12)
rot
plot.ts(rot, ylab = "Ret", xlab = "Mes", col="blue")
boxplot(rot)
class(rot)
fit<-decompose(rot, type = "mult")
autoplot(fit)
Error: object 'x' not found
yet aside from that, i would expect you would get the error :
Error: Objects of type decomposed.ts not supported by autoplot.
but you dont ?
Sorry.
The "x" is the variable where I read the dataset from excel.
I suppose you omitted required libs ggfortify and zoo, if autoplot is desired to plot the ts in a ggplot2 compatible way.
try
if(!require("astsa")) install.packages("astsa")
require(astsa)

library(ggplot2)

rot <-ts(astsa::birth, start = c(1948,1), end = c(1949,12), frequency = 12)
rot
plot.ts(rot, ylab = "Ret", xlab = "Mes", col="blue")


fit<-decompose(rot, type = "mult")

if(!require("ggfortify")) install.packages("ggfortify")
require(ggfortify)
if(!require("zoo")) install.packages("zoo")
require(zoo)

autoplot(fit)
#example of changing the date breaks on the axis
autoplot(fit) + scale_x_date(date_breaks = "3 months")Thank you so much! Do you know how to increase the size of the xlabel and ylabel using autoplot?
+ theme(strip.text.x=element_text(size=24),
axis.text=element_text(size=12))THANK YOU!!! You saved me!!! Thank you so much!!
This topic was automatically closed 21 days after the last reply. New replies are no longer allowed.
If you have a query related to it or one of the replies, start a new topic and refer back with a link.