Hi!
I'm doing a PLS of 1 component and I would like to know if it possible to include the samples name in the score plot.
The commands done:
Urine_data <- read_excel("NORMALIZED.xlsx")
Groups <- Urine_data$Groups
ID <- Urine_data$ID
Concentrations <- as.numeric(colnames(Urine_data))
x <- as.matrix(Urine_data[,c(3:12)])
Urine_data.pls <- opls(Urine_data[,c(3:12)], Urine_data$Groups, predI = 1, crossvalI = 7, scaleC = 'standard')
plot(Urine_data.pls@scoreMN)
The score plot and the data:
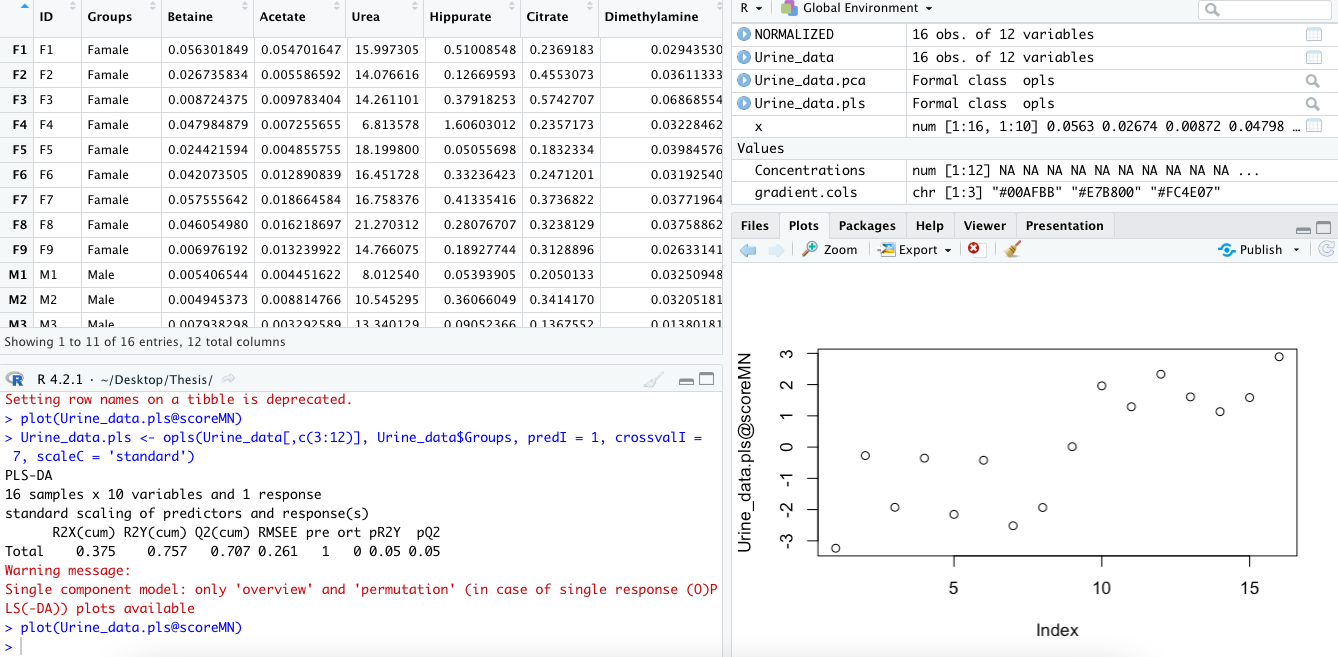
I would like to include "F1", "F2", etc.