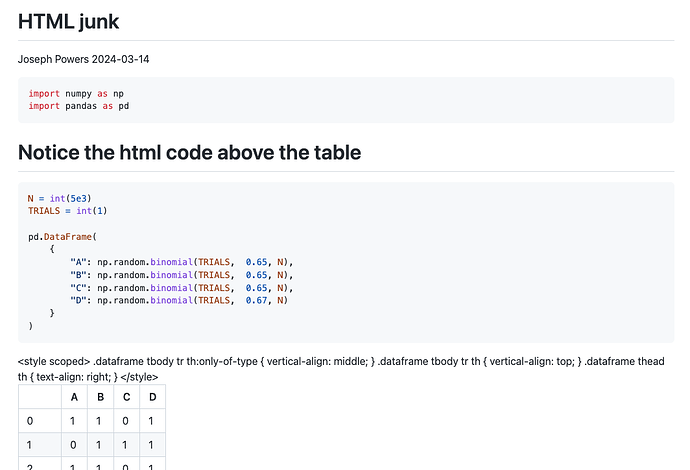
When I display a pandas table in a quarto gfm report I see html code above the table when I view the report in github. How can I prevent this?
---
title: 'HTML junk'
author: 'Joseph Powers'
date: 2024-03-14
format: gfm
---

```{python}
import numpy as np
import pandas as pd
```

# Notice the html code above the table
```{python}
N = int(5e3)
TRIALS = int(1)

pd.DataFrame(
    {
        "A": np.random.binomial(TRIALS,  0.65, N),
        "B": np.random.binomial(TRIALS,  0.65, N),
        "C": np.random.binomial(TRIALS,  0.65, N),
        "D": np.random.binomial(TRIALS,  0.67, N)
    }
)
```
I can't replicate this on MacOS 12.3.1 and Quarto 1.4.551.
Everything is printing as intended.
---
format: gfm
---

```{python}
import numpy as np
import pandas as pd
```

```{python}
N = int(5e3)
TRIALS = int(1)

pd.DataFrame(
    {
        "A": np.random.binomial(TRIALS,  0.65, N),
        "B": np.random.binomial(TRIALS,  0.65, N),
        "C": np.random.binomial(TRIALS,  0.65, N),
        "D": np.random.binomial(TRIALS,  0.67, N)
    }
)
```
What Quarto version are you using? Did you use any particular chunk attributes?
The report looks fine when previewed locally, but when pushed and viewed in GitHub the html is visible.
MacOS Sonoma 14.3.1 and Quarto 1.4.537.
Ah yeah my bad, I read too quickly and missed the GitHub part. This is the normal behavior because GitHub sanitizes the HTML before rendering it to prevent malicious code from being executed.
I don't think there's a way to stop Quarto from generating the style but maybe someone has a solution. In the meantime you can safely remove the <style></style> tags from the .md file although it will be added every time your render your document.
cderv
March 21, 2024, 1:23pm
5
I think this discussion could be off interest
opened 05:53PM - 26 Aug 22 UTC
closed 10:13PM - 25 Jan 23 UTC
bug
upstream
### Bug description
gfm output that has pandas dataframes printed out, renders … incorrectly on Github, possibly because of GitHub not respecting <style scoped> tags.
Input qmd:
````md
---
title: "Untitled"
format: gfm
---
```{python}
import pandas as pd
iris = pd.read_csv('https://raw.githubusercontent.com/mwaskom/seaborn-data/master/iris.csv')
iris.head()
```
````
Output md raw:
````
Untitled
================
``` python
import pandas as pd
iris = pd.read_csv('https://raw.githubusercontent.com/mwaskom/seaborn-data/master/iris.csv')
iris.head()
```
<div>
<style scoped>
.dataframe tbody tr th:only-of-type {
vertical-align: middle;
}
.dataframe tbody tr th {
vertical-align: top;
}
.dataframe thead th {
text-align: right;
}
</style>
<table border="1" class="dataframe">
<thead>
<tr style="text-align: right;">
<th></th>
<th>sepal_length</th>
<th>sepal_width</th>
<th>petal_length</th>
<th>petal_width</th>
<th>species</th>
</tr>
</thead>
<tbody>
<tr>
<th>0</th>
<td>5.1</td>
<td>3.5</td>
<td>1.4</td>
<td>0.2</td>
<td>setosa</td>
</tr>
<tr>
<th>1</th>
<td>4.9</td>
<td>3.0</td>
<td>1.4</td>
<td>0.2</td>
<td>setosa</td>
</tr>
<tr>
<th>2</th>
<td>4.7</td>
<td>3.2</td>
<td>1.3</td>
<td>0.2</td>
<td>setosa</td>
</tr>
<tr>
<th>3</th>
<td>4.6</td>
<td>3.1</td>
<td>1.5</td>
<td>0.2</td>
<td>setosa</td>
</tr>
<tr>
<th>4</th>
<td>5.0</td>
<td>3.6</td>
<td>1.4</td>
<td>0.2</td>
<td>setosa</td>
</tr>
</tbody>
</table>
</div>
````
Output md rendered:
```
Untitled
================
``` python
import pandas as pd
iris = pd.read_csv('https://raw.githubusercontent.com/mwaskom/seaborn-data/master/iris.csv')
iris.head()
```
<div>
<style scoped>
.dataframe tbody tr th:only-of-type {
vertical-align: middle;
}
.dataframe tbody tr th {
vertical-align: top;
}
.dataframe thead th {
text-align: right;
}
</style>
<table border="1" class="dataframe">
<thead>
<tr style="text-align: right;">
<th></th>
<th>sepal_length</th>
<th>sepal_width</th>
<th>petal_length</th>
<th>petal_width</th>
<th>species</th>
</tr>
</thead>
<tbody>
<tr>
<th>0</th>
<td>5.1</td>
<td>3.5</td>
<td>1.4</td>
<td>0.2</td>
<td>setosa</td>
</tr>
<tr>
<th>1</th>
<td>4.9</td>
<td>3.0</td>
<td>1.4</td>
<td>0.2</td>
<td>setosa</td>
</tr>
<tr>
<th>2</th>
<td>4.7</td>
<td>3.2</td>
<td>1.3</td>
<td>0.2</td>
<td>setosa</td>
</tr>
<tr>
<th>3</th>
<td>4.6</td>
<td>3.1</td>
<td>1.5</td>
<td>0.2</td>
<td>setosa</td>
</tr>
<tr>
<th>4</th>
<td>5.0</td>
<td>3.6</td>
<td>1.4</td>
<td>0.2</td>
<td>setosa</td>
</tr>
</tbody>
</table>
</div>
```
I am on Mac OS Big Sur and using VS Code 1.70.2.
### Checklist
- [X] Please include a minimal, fully reproducible example in a single .qmd file? Please provide the whole file rather than the snippet you believe is causing the issue.
- [X] Please [format your issue](https://yihui.org/issue/#please-format-your-issue-correctly) so it is easier for us to read the bug report.
- [X] Please document the RStudio IDE version you're running (if applicable), by providing the value displayed in the "About RStudio" main menu dialog?
- [X] Please document the operating system you're running. If on Linux, please provide the specific distribution.
The <style> is added by Pandas output representation, but this is not compatible with Github Markdown.
You would need to customize the output of your Pandas DataFrame
Hope this helps
system
May 2, 2024, 1:23pm
6
This topic was automatically closed 42 days after the last reply. New replies are no longer allowed.
