how can I pivot this table ?

Hi,
i need to clean some data. I believe I will need to pivot_long and mutate in order to get the sum of the values.

Any idea how could I do this?

Thanks in advance

#start
structure(list(...1 = c("Mercedes", "Opel", "VW"), T1 = c(1, 
1, 2), T2 = c(3, 5, 2), T3 = c(5, 5, 2), T4 = c("1", "na", "2"
), year = c(2021, 2021, 2021)), class = c("tbl_df", "tbl", "data.frame"
), row.names = c(NA, -3L))```{r}
#what i would like to have

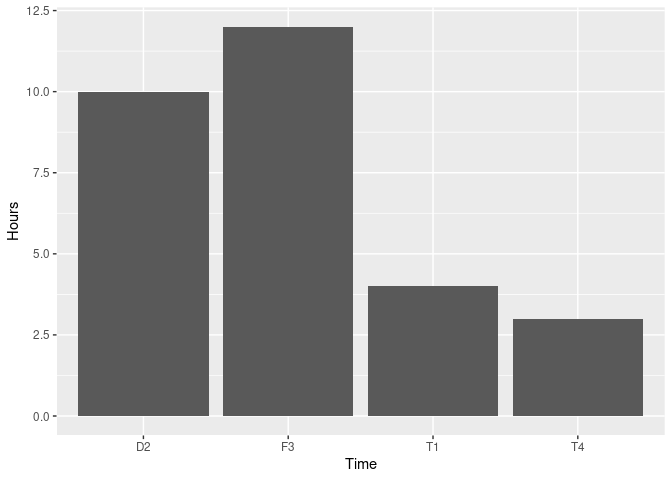
structure(list(...1 = c("Mercedes", "Opel", "VW", "T1", "T2", 
"T3", "T4"), year = c(2021, 2021, 2021, NA, NA, NA, NA), total_T = c(NA, 
NA, NA, 4, 10, 12, 3)), class = c("tbl_df", "tbl", "data.frame"
), row.names = c(NA, -7L))

I tried this but it did not work..
start |>
mutate(T1_Tot,sum(start$T1) )

pivot_longer(T1, names_to = "Tot1", values_to = "T_Total1") |>
pivot_longer(T2, names_to = "Tot2", values_to = "T_Total2") |>
pivot_longer(T3, names_to = "Tot3", values_to = "T_Total3") |>
pivot_longer(T4, names_to = "Tot4", values_to = "T_Total4") |>

mutate(start$total, sum(dat$T1))

start |>
mutate(Total_T =
case_when(T1= sum(T1) ~ "value") |>
case_when(T2 = sum (T2) ~ "value" ) |>
case_when(T3 = sum (T3) ~ "value" ) |>
case_when(T4 = sum (T4) ~ "value" ))

Your desired output is by no means cleaner than the original data frame because you are mixin data inside the same column and losing structure. I think this would be better to achieve your goal:

library(dplyr)
library(tidyr)

sample_df <- structure(list(...1 = c("Mercedes", "Opel", "VW"), T1 = c(1, 
                                                                       1, 2), T2 = c(3, 5, 2), T3 = c(5, 5, 2), T4 = c("1", "na", "2"
                                                                       ), year = c(2021, 2021, 2021)), class = c("tbl_df", "tbl", "data.frame"
                                                                       ), row.names = c(NA, -3L))

sample_df %>%
    mutate(across(starts_with("T"), as.numeric)) %>% 
    pivot_longer(cols = starts_with("T"), names_to = "T", values_to = "values") %>% 
    group_by(name = ...1, year) %>% 
    summarise(total_T = sum(values, na.rm = TRUE), .groups = "drop")
#> # A tibble: 3 × 3
#>   name      year total_T
#>   <chr>    <dbl>   <dbl>
#> 1 Mercedes  2021      10
#> 2 Opel      2021      11
#> 3 VW        2021       8

Created on 2023-02-02 with reprex v2.0.2

Dear @andresrcs,

thanks for your reply but I actually want something different that what you proposed.

see below:

structure(list(...1 = c("Mercedes", "Opel", "VW", "T1", "D2", 
"F3", "T4"), year = c(2021, 2021, 2021, NA, NA, NA, NA), total_T = c(NA, 
NA, NA, 4, 10, 12, 3)), class = c("tbl_df", "tbl", "data.frame"
), row.names = c(NA, -7L))
#start

```{r}
structure(list(...1 = c("Mercedes", "Opel", "VW"), T1 = c(1, 
1, 2), D2 = c(3, 5, 2), F3 = c(5, 5, 2), T4 = c("1", "na", "2"
), year = c(2021, 2021, 2021)), class = c("tbl_df", "tbl", "data.frame"
), row.names = c(NA, -3L))

also the original data has many variables which start with T , so changed a bit the dataframe.

I am doing this because I would like to plot later those values.

Thanks in advance

What kind of plot do you want to get? What you are asking for is essentially two independent data frames arbitrarily binded row-wise and that is not easy to work with.
If you state your ultimate goal (a specific plot) I think I could provide you with an alternative approach.

this is not clear yet, bar chart or box plot

But which variables would be on the x-axis and y-axis respectively?

in the x-axis will be the time and the y -axis the count (hours) for the:

T1 will be 4 hours for the
D2 will be 10 hours
F3 will be 12hours and
T4 will be 3 hours

(this is a simulated data ) I can not share the original data

Like this?

library(tidyverse)

sample_df <- structure(list(...1 = c("Mercedes", "Opel", "VW"), T1 = c(1, 
                                                                       1, 2), D2 = c(3, 5, 2), F3 = c(5, 5, 2), T4 = c("1", "na", "2"
                                                                       ), year = c(2021, 2021, 2021)), class = c("tbl_df", "tbl", "data.frame"
                                                                       ), row.names = c(NA, -3L))

sample_df %>%
    mutate(across(matches("^.\\d"), as.numeric)) %>% 
    pivot_longer(cols = matches("^.\\d"), names_to = "Time", values_to = "Hours") %>% 
    group_by(Time) %>% 
    summarise(Hours = sum(Hours, na.rm = TRUE)) %>% 
    ggplot(aes(x = Time, y = Hours)) +
    geom_col()

Created on 2023-02-02 with reprex v2.0.2

yes, that is exactly what i want.
Unfortunately it gives me an error Error in pivot_longer():
! cols must select at least one column

I believe I will need to specify the column name, what do you think?

For any reason the cols = matches("^.\d") did not work

What do you think?

thanks in advance

"^.\\d" this is called a Regular Expression and it is used to describe a text pattern, if your actual column names do not follow this pattern it is not going to work. You can pass a vector with the column names but if you have a lot of columns to pivot it would not be very efficient.

thanks Andres,
I wrote the vector c(T1,D2, F3, T4) instead of ("^.\d"), is this what you meant? i still get the error, should i also change the vector in this line?

mutate(across(matches("^.\d"), as.numeric)) %>%

dat_all_TIC %>%
mutate(across(matches("^.\d"), as.numeric)) %>%
pivot_longer(cols = c(T1,D2, F3, T4), names_to = "Time", values_to = "Hours") %>%
group_by(Time) %>%
summarise(Hours = sum(Hours, na.rm = TRUE)) %>%
ggplot(aes(x = Time, y = Hours)) +
geom_col()

Error in pivot_longer():
! Can't subset columns that don't exist.

thanks very much for helping me out

Yes, but

This suggest your column names are not exactly those. It is hard to help you with this without a reproducible example (with sample data that actually produces the error message).

thanks very much Andres, you already gave me the answer...I will keep trying with my data.

This topic was automatically closed 7 days after the last reply. New replies are no longer allowed.

If you have a query related to it or one of the replies, start a new topic and refer back with a link.