Question: How can I output multiple filtered results into multiple boxes?"
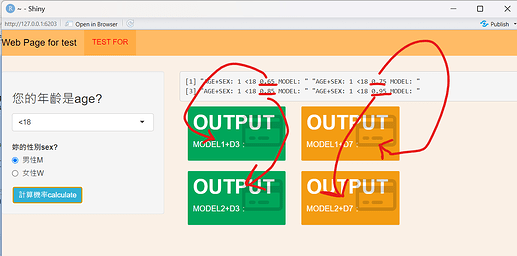
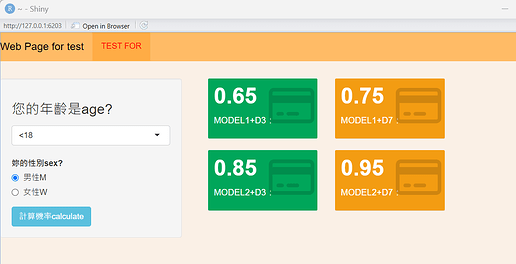
The goal is that when a user selects gender and age, then clicks the calculate button, the corresponding values will be displayed (the 4 boxes correspond to combinations of Model 1 or 2, and 3 or 7 observation days).
Currently, I have achieved displaying 4 probabilities after the user selects gender and age and clicks the calculate button, but I am unsure how to assign the values to the corresponding boxes for display.
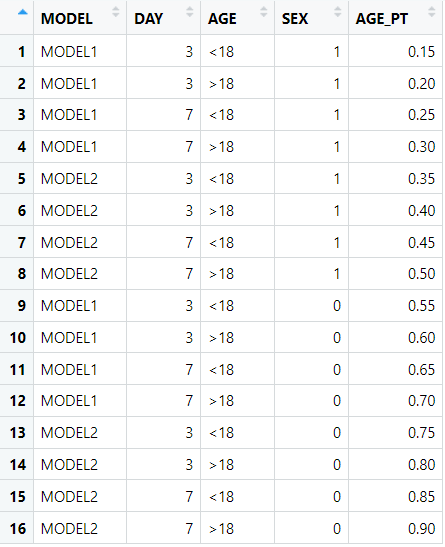
Here is probability data:
My expected result:
Here is code:
library(shiny)
library(shinyWidgets)

library(dplyr)
library(fresh)    #應該是調整格式之類的?
library(bslib)
library(shinydashboard)


data_1 <- data.frame(
  MODEL=rep(c("MODEL1","MODEL1","MODEL1","MODEL1","MODEL2","MODEL2","MODEL2","MODEL2"),2),
    DAY=rep(c(3,3,7,7),4),
    AGE=rep(c("<18",">18"),8),
    SEX=c(1,1,1,1,1,1,1,1,0,0,0,0,0,0,0,0),
  AGE_PT=c(0.15,0.2,0.25,0.3,0.35,0.4,0.45,0.5,0.55,0.6,0.65,0.7,0.75,0.8,0.85,0.9)
)


ui <- fluidPage(
  tags$head(
    #調整:font-size字體大小,padding內邊距,border-radius圓角幅度
    #.inner_container_pad=調整內邊距(因應將邊框留白取消)
    #div.container-fluid=將邊距調整為不留白
    tags$style(HTML("
        .inner_container_pad {
          padding-left:15px;
          padding-right:15px;
        }
        div.container-fluid {
          padding-left:0;
          padding-right:0;
          margin-left:0;
          margin-right:0;
        }
        "))
  ),

  setBackgroundColor( #背景顏色
    color = c("#FAF0E6", "#FAF0E6"),gradient = "radial",direction = c("top", "left")),
  navbarPage(
    position = "fixed-top", #固定位置在最上面,像EXCEL凍結窗格
    collapsible = TRUE,#當頁面太小,將折疊上方選單成≡
    header = use_theme(
      create_theme(
        theme = "default",
        bs_vars_navbar(
          default_bg="#FFBB66",  #背景顏色
          default_border="#FFBB66",  #邊界顏色
          default_link_color="#000000",  #文字顏色
          default_link_active_color="#FF0000", #選取的文字顏色
          default_link_hover_color="#0000FF"))),  #滑鼠停留顏色
    footer = tagList(
      useShinydashboard()),

    title=("Web Page for test"),  tabPanel("TEST FOR "),br(),br(),br(),br(),

  # Sidebar layout

  sidebarLayout(
    sidebarPanel(

      #年齡層下拉選擇按鈕
      selectInput("AGE",label = h3("您的年齡是age?"),
                  choices = c("<18",">18"),
                  selected = "<18"),

      # 性別圓形選擇按鈕

      radioButtons(
        inputId = "SEX",
        label = "妳的性別sex?",
        choices = c("男性M" = 1, "女性W" = 0)
      ),


      #可以點的按鈕,點下去才會計算
      actionButton(
        inputId = "calculate",
        label = "計算機率calculate",
        class = "btn-info"
      )
    ),

    # Web page for pt

    mainPanel(
          verbatimTextOutput("results"),
      fluidRow(column(12,
          valueBoxOutput(outputId = "box_m1_d3"),
          valueBoxOutput(outputId = "box_m1_d7"))),
      fluidRow(column(12,
          valueBoxOutput(outputId = "box_m2_d3"),
          valueBoxOutput(outputId = "box_m2_d7")))

    )
  )
)
)


server <- function(input, output) {

  dataInput <- reactive({
    data_1 %>%
      filter(AGE == input$AGE,
             SEX == input$SEX)
  }) %>%
    bindEvent(input$calculate)

  output$results <- renderPrint({
    res <- as.numeric(input$SEX)*0.5 + dataInput()$AGE_PT

    paste("AGE+SEX:",input$SEX,input$AGE,res,"MODEL:" ,input$MODEL)
  }) %>%
    bindEvent(dataInput())

  #box_m1_d3
  output$box_m1_d3 <- renderValueBox({
    valueBox(
      value="OUTPUT",
      subtitle="MODEL1+D3:",
      icon = icon("credit-card"),color="green")
  })

  #box_m1_d7
  output$box_m1_d7 <- renderValueBox({
    valueBox(
      value="OUTPUT",
      subtitle="MODEL1+D7:",
      icon = icon("credit-card"),color="yellow")
  })

  #box_m2_d3
  output$box_m2_d3 <- renderValueBox({
    valueBox(
      value="OUTPUT",
      subtitle="MODEL2+D3:",
      icon = icon("credit-card"),color="green")
  })

  #box_m2_d7
  output$box_m2_d7 <- renderValueBox({
    valueBox(
      value="OUTPUT",
      subtitle="MODEL2+D7:",
      icon = icon("credit-card"),color="yellow")
  })
}

# Run the application

shinyApp(ui = ui, server = server)
Thanks a lot!


