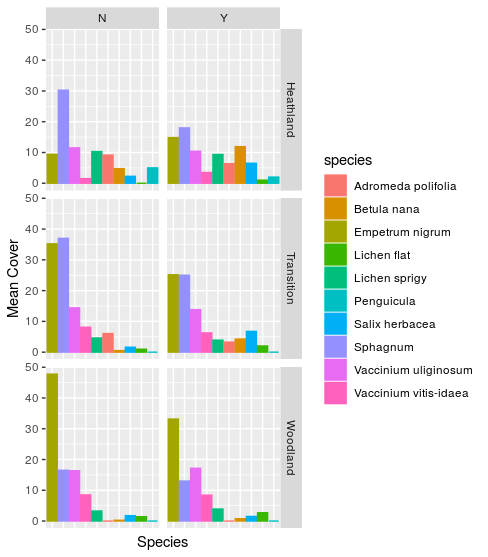
I've made a graph of mean cover of different species in 3 different areas with the inclusion of one species (y) and exclusion of the same species (n) on different graphhs. however I'm struggling to place the two graphs of y and n together in Rstudio for comparison
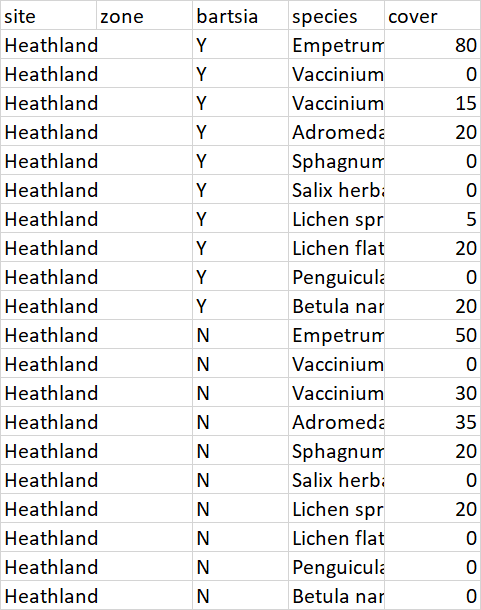
site		bartsia	            species	cover
Heathland		Y	Empetrum nigrum	80
Heathland		Y	Vaccinium vitis-idaea	0
Heathland		Y	Vaccinium uliginosum	15
Heathland		Y	Adromeda polifolia	20
Heathland		Y	Sphagnum	0
Heathland		Y	Salix herbacea	0
Heathland		Y	Lichen sprigy	5
Heathland		Y	Lichen flat	20
Heathland		Y	Penguicula	0
Heathland		Y	Betula nana	20
Heathland		N	Empetrum nigrum	50
Heathland		N	Vaccinium vitis-idaea	0
Heathland		N	Vaccinium uliginosum	30
Heathland		N	Adromeda polifolia	35
Heathland		N	Sphagnum	20
Heathland		N	Salix herbacea	0
Heathland		N	Lichen sprigy	20
Heathland		N	Lichen flat	0
Heathland		N	Penguicula	0
Heathland		N	Betula nana	0
We need actual sample data on a copy/paste friendly format, not a screenshot of it.
To help us help you, please prepare a reproducible example (reprex) illustrating your issue. Please have a look at this guide, to see how to create one: