Hi, I'm very new to R, I have a question.
As the title says, how can I join 2 graphics into one?
A + B
A
B
I have 2 ways in which I made the Graphics.
1)
library(ggplot2)
library(tidyverse)
library(dplyr)
#dataset%>%
ggplot(dataset)+  #Geom_Line de BLScrap
  geom_line(mapping = aes(x = Lotname, y = BLScrap, group = PowderName),col = "Red",linetype = "dashed")+
  geom_point(mapping = aes(x = Lotname, y = BLScrap),col = "Red")+scale_y_continuous("BLAmountStarted & BLAmountFinished",sec.axis = sec_axis(~ ., name = "BLScrap"))+
  #Geom_Line de BLAmountStarted
  geom_line(mapping = aes(x = Lotname, y = BLAmountStarted, group = PowderName), col = "green")+
  geom_point(mapping = aes(x = Lotname, y = BLAmountStarted, group = PowderName), col = "Green")+
  #Geom_Line de BLAmountFinished
  geom_line(mapping = aes(x = Lotname, y = BLAmountFinished, group = PowderName), col = "Blue")+
  geom_point(mapping = aes(x = Lotname, y = BLAmountFinished), col = "Blue")+
  #Style
  theme_classic()+theme(axis.text.x=element_text(angle=-90, vjust=0.5, hjust=0))+
  labs(title = "KBP BL Amount")
library(ggplot2)
library(tidyverse)
library(dplyr)
#dataset%>%
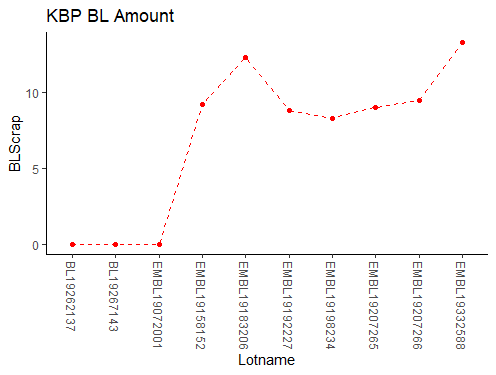
A <- ggplot(dataset)+ #Geom_Line de BLScrap
geom_line(mapping = aes(x = Lotname, y = BLScrap, group = PowderName),col = "Red",linetype = "dashed")+
geom_point(mapping = aes(x = Lotname, y = BLScrap),col = "Red")+
#Style
theme_classic()+theme(axis.text.x=element_text(angle=-90, vjust=0.5, hjust=0))+
labs(title = "KBP BL Amount")
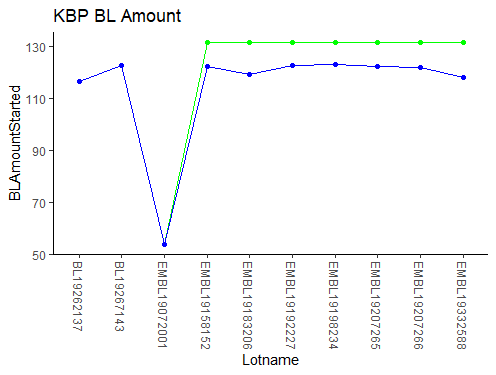
B <-ggplot(dataset)+
#Geom_Line de BLAmountStarted
geom_line(mapping = aes(x = Lotname, y = BLAmountStarted, group = PowderName), col = "green")+
geom_point(mapping = aes(x = Lotname, y = BLAmountStarted, group = PowderName), col = "Green")+
#Geom_Line de BLAmountFinished
geom_line(mapping = aes(x = Lotname, y = BLAmountFinished, group = PowderName), col = "Blue")+
geom_point(mapping = aes(x = Lotname, y = BLAmountFinished), col = "Blue")+
theme_classic()+theme(axis.text.x=element_text(angle=-90, vjust=0.5, hjust=0))+
labs(title = "KBP BL Amount")
In the number 1 is how I want it to be just that the scale does not fit the red line,
and 2 is my second method to join them in one way.