jia1999
1
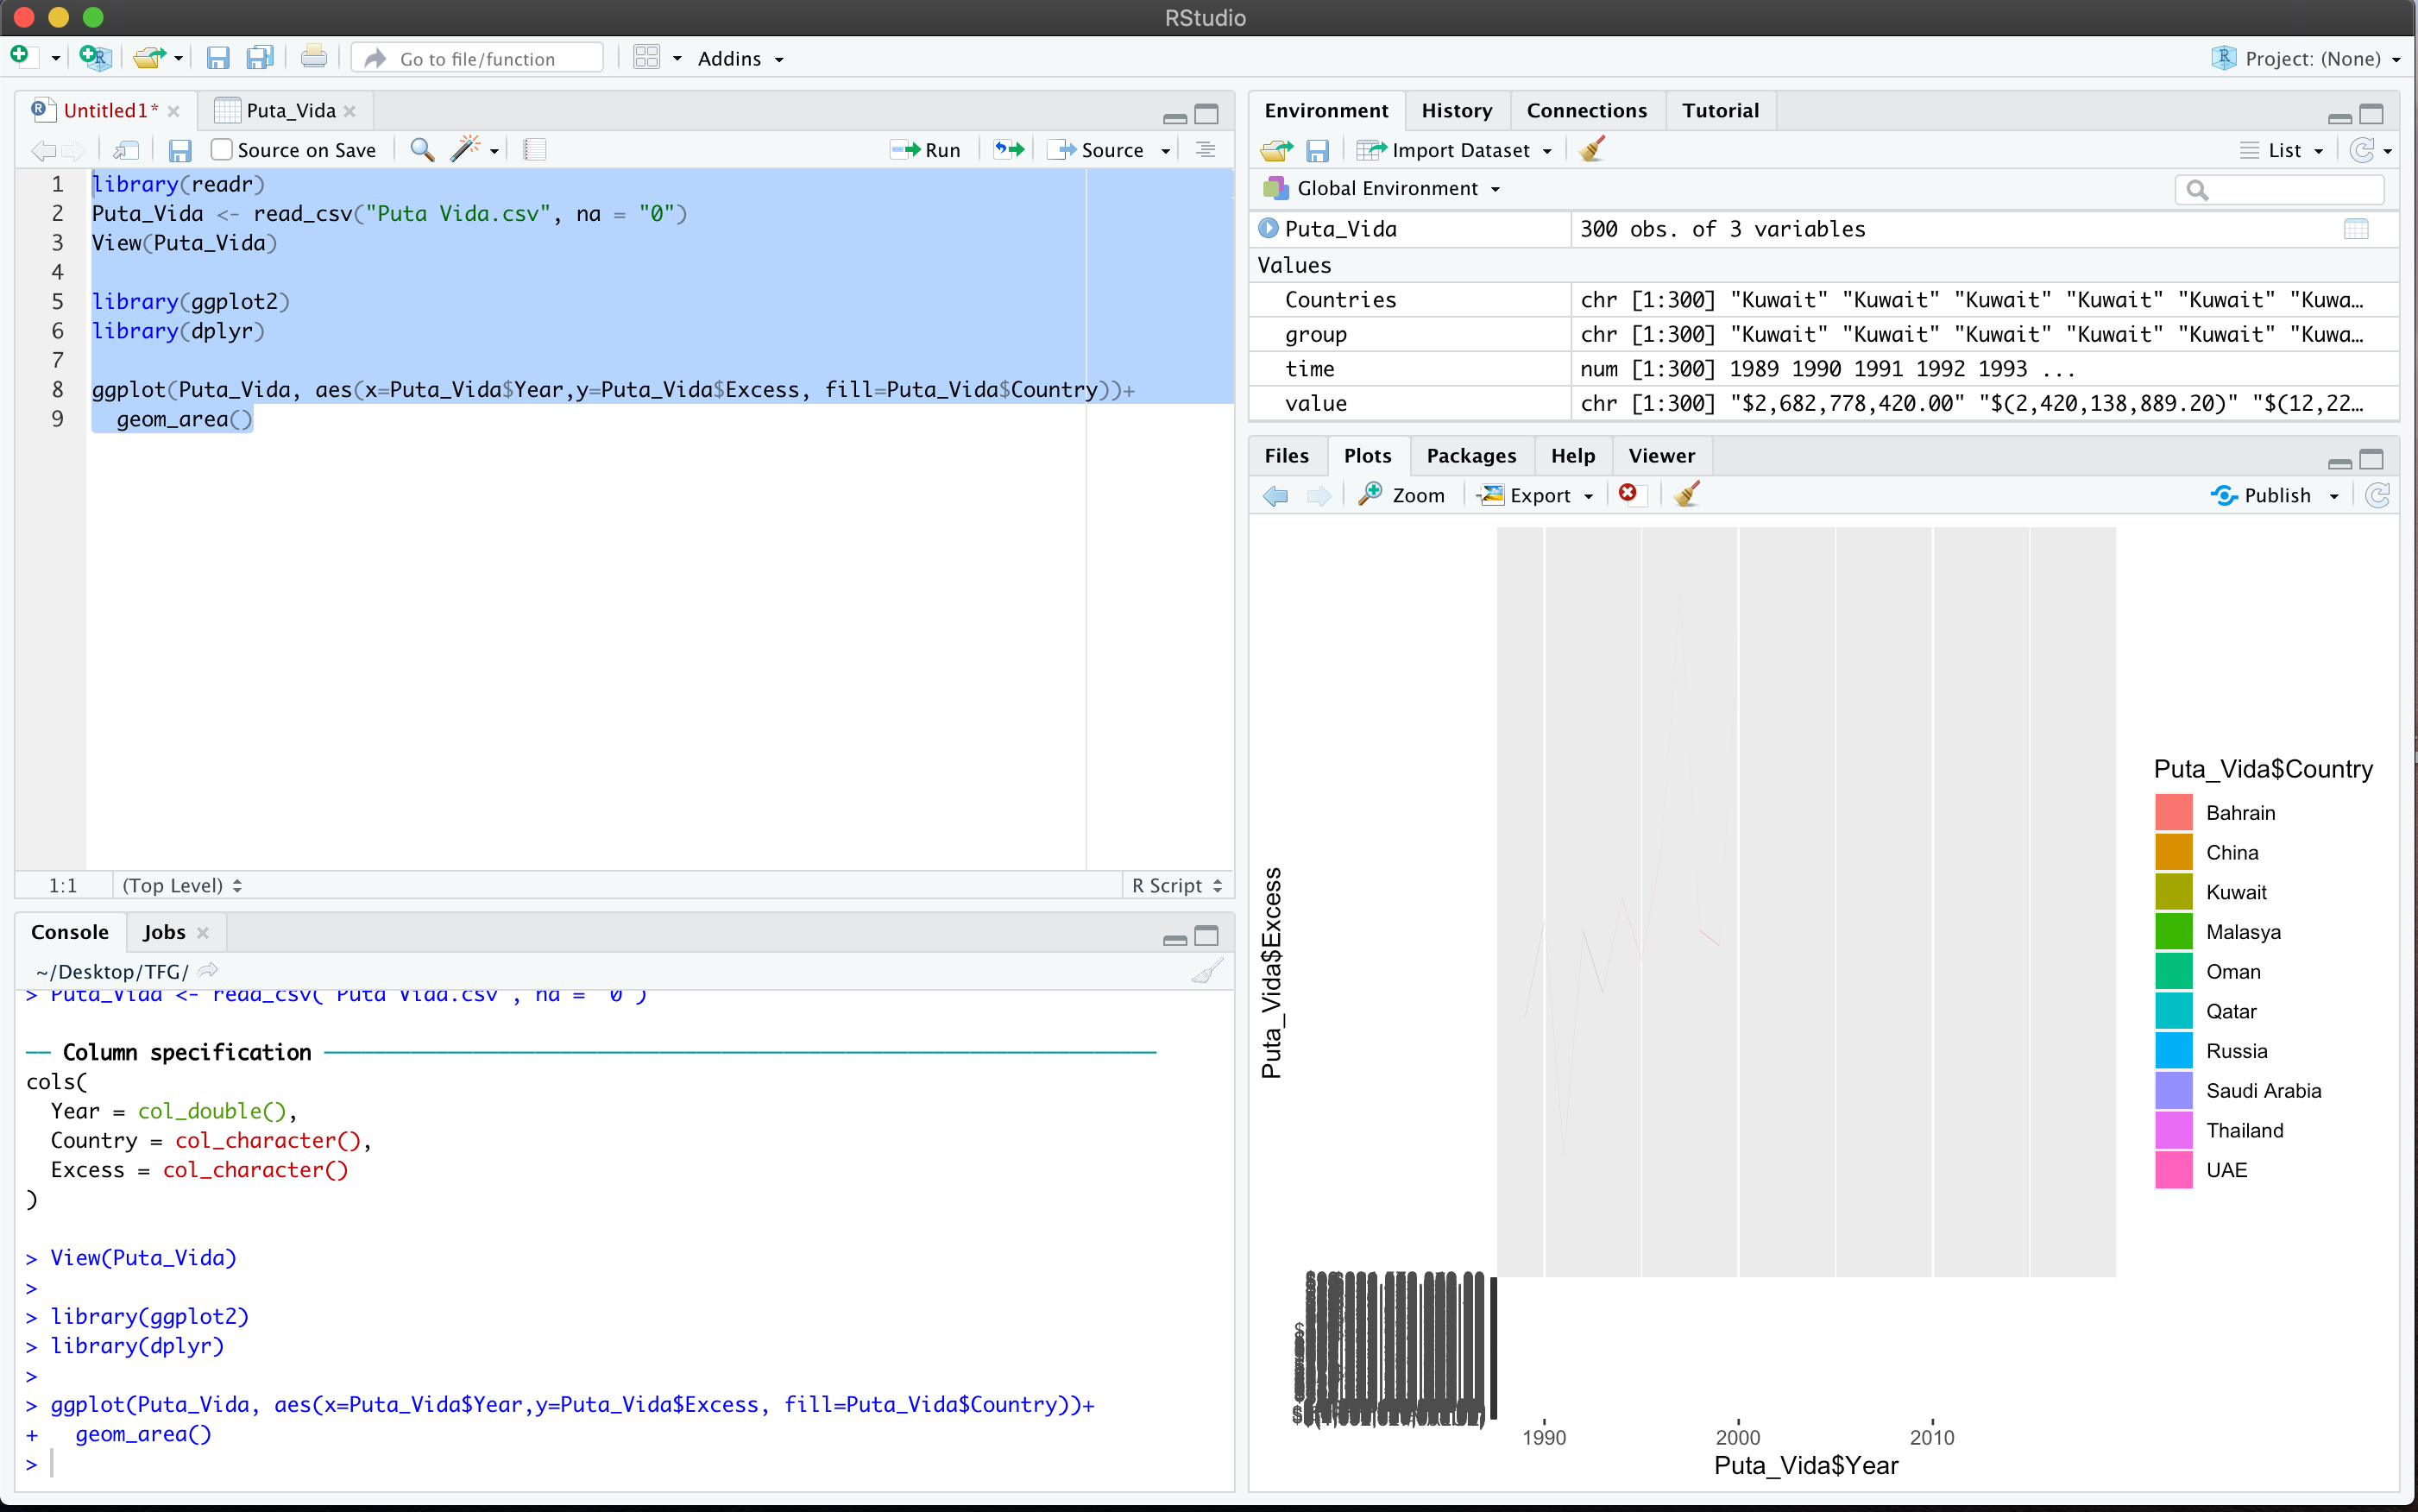
I tried the following
library(readr)
Puta_Vida <- read_csv("Puta Vida.csv", na = "0")
View(Puta_Vida)
library(ggplot2)
library(dplyr)
ggplot(Puta_Vida, aes(x=Puta_Vida$Year,y=Puta_Vida$Excess, fill=Puta_Vida$Country))+
geom_area()
However I cannot manage to get a proper stacked area graph
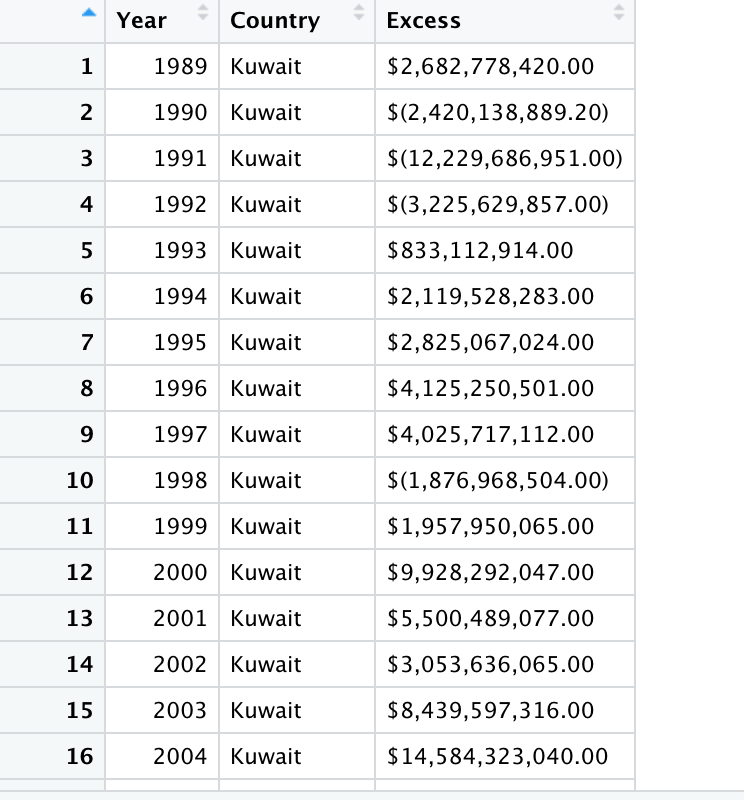
my data is like this:
Can you please share a small part of the data set in a copy-paste friendly format?
In case you don't know how to do it, there are many options, which include:
-
If you have stored the data set in some R object, dput function is very handy.
-
In case the data set is in a spreadsheet, check out the datapasta package. Take a look at this link.
Or, even better, Can you provide a proper REPRoducible EXample (reprex) illustrating your issue?
system
Closed
3
This topic was automatically closed 21 days after the last reply. New replies are no longer allowed.
If you have a query related to it or one of the replies, start a new topic and refer back with a link.