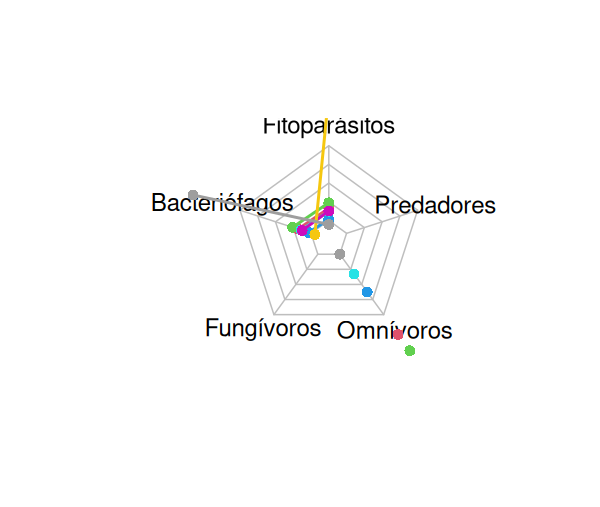
This is the code that don´t function to me. This use fmsb and I try with ggradar but I can't installed.
library(ggplot2)
library(fmsb)
Nema_0.2<-c(60.42,38.52,0,1.04,0)
Nema_0.4<-c(3.125,96.875,0,0,0)
Nema_0.6<-c(12.44,86.18,0,1.38,0)
Ajo_2.5<-c(16.67,81.67,0,1.66,0)
Ajo_5<-c(3.92,94.78,0,0.65,0.65)
Hulk_0.2<-c(10.2,88.78,0,0.34,0.68)
Control<-c(10.40,89.60,0,0,0)
Max<-c(100,100,100,100,100)
Min<-c(0,0,0,0,0)
valores_clases <- data.frame(rbind(
  Nema_0.2,Nema_0.4,Nema_0.6,
Ajo_2.5,Ajo_5,Hulk_0.2,Control,Max,Min
))
colnames(valores_clases)<-paste(c("Fitoparásitos", "Bacteriófagos", "Fungívoros", "Omnívoros", "Predadores"))
areas <- c(rgb(1, 0, 0, 0.25),
           rgb(0, 1, 0, 0.25),
           rgb(0, 0, 1, 0.25),
           rgb(1, 1, 0, 0.25),
           rgb(1, 0, 1, 0.25),
           rgb(0, 1, 1, 0.25),
           rgb(0.5, 0.5, 0.5, 0.25))
radarchart(valores_clases,
           cglty = 1,
           cglcol = "gray",
           pcol = 2:8,
           plwd = 2,
           plty = 1,
           pfcol = areas)
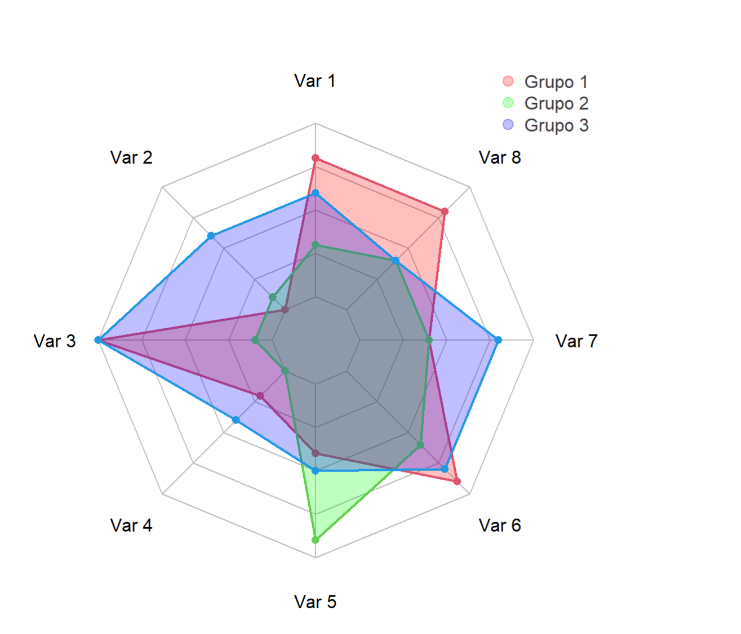
Este es el gráfico que busco obtener:
My regards!
Sá, Farid Leonel.