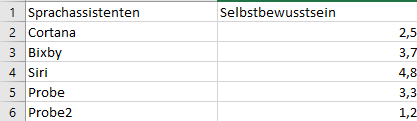
Hi, I am trying to make boxplots for the different types of voice assistants in R but I always get this error -->
Fehler in x[floor(d)] + x[ceiling(d)] :
  nicht-numerisches Argument für binären Operator
This is my spreadsheet that I made in Excel, and next to it are the averages that I came up with based on a survey that I did [*small part of it].