How can I connect geom_vline() lines across facets for single subject design plots

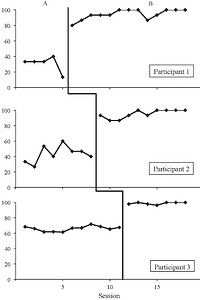
The standard for plotting multiple baseline single subject designs in behavioral research is something like this:, where the vertical lines separating treatment phases are connected across treatment cases.

How can I connect the vertical lines that split phases in ggplot?

Reprex:

  library(tidyverse)
  
  set1 = tribble(
    ~phase, ~session, ~outcome,
    "baseline", 1, 0,
    "baseline", 2, 10,
    "baseline", 3, 10,
    "baseline", 4, 0,
    "baseline", 5, 0,
    "treatment", 6, 20,
    "treatment", 7, 30,
    "treatment", 8, 40,
    "treatment", 9, 40, 
    "treatment", 10, 50,
    "treatment", 11, 60,
    "treatment", 12, 80,
    "treatment", 13, 90,
    "treatment", 15, 90,
    "treatment", 17, 80,
    "treatment", 19, 100,
    "treatment", 21, 90
  ) %>% mutate(set = "set1")
  
  set2 = tribble(
    ~phase, ~session, ~outcome,
    "baseline", 1, 10,
    "baseline", 2, 10,
    "baseline", 3, 10,
    "baseline", 4, 5,
    "baseline", 5, 0,
    "baseline", 6, 10,
    "baseline", 7, 10,
    "baseline", 8, 10,
    "baseline", 9, 5, 
    "baseline", 10, 0,
    "baseline", 11, 10,
    "baseline", 12, 10,
    "baseline", 13, 10,
    "treatment", 14, 20,
    "treatment", 15, 30,
    "treatment", 16, 40,
    "treatment", 17, 50,
    "treatment", 18, 50,
    "treatment", 19, 70,
    "treatment", 20, 80,
    "treatment", 21, 90
  ) %>% mutate(set = "set2")
  
  dat = bind_rows(set1, set2)
  
  lines = tibble(
    set = c("set1","set2"),
    line = c(5.5, 13.5)
  )
  
  dat %>%
    ggplot(aes(x = session, y = outcome, group = phase)) +
    geom_line() + 
    geom_point() +
    geom_vline(data = lines, aes(xintercept = line)) + 
    facet_wrap(~set, ncol = 1, scales = "free_x") +
    scale_x_continuous(minor_breaks = seq(1, 25, 1), breaks = c(1, 5, 10, 15, 20, 25))
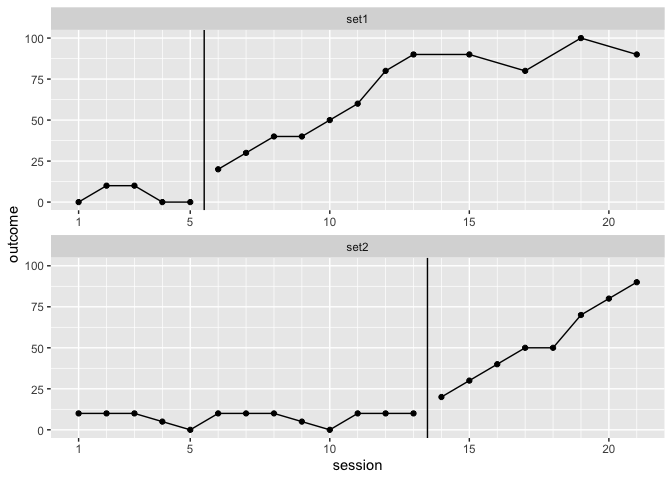
Created on 2022-03-30 by the reprex package (v2.0.1)
I don't know of a simple way to do this in ggplot2, and a solution would either require some hacking or finding an addon package for this use case.

Here are some potential approaches:

  1. fake the facets altogether:
  1. use grid and a custom function to lay out the facets and connect the lines:

http://rstudio-pubs-static.s3.amazonaws.com/410976_f8eb6b218bfa42038a8b7bc9a6f9a193.html

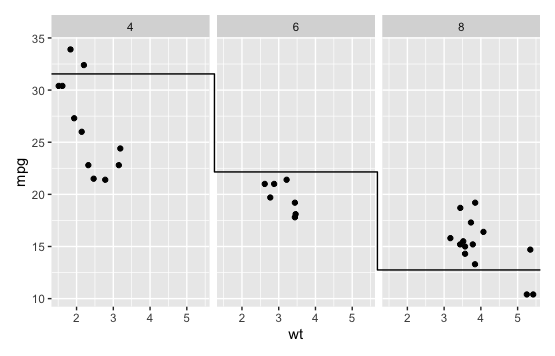
  1. use patchwork and do something kinda manual. This might be the easiest solution for a one-off:

library(ggplot2)
library(patchwork)

base <- ggplot(mtcars, aes(wt, mpg)) +
  geom_point() +
  facet_wrap(~cyl) 

segments <- ggplot(data = data.frame(x = c(0, 2, 2, 4, 4, 6),
                                     y = c(2, 2, 1, 1, 0, 0)),
                   aes(x=x, y=y)) +
  geom_path() +
  theme_void()


base + inset_element(
  segments, left = -0.05, bottom = 0.1, right = 1.05, top = 0.9)

Rplot157

Interesting! ok thanks I could see this working. I'll have to see if I can create a standalone function that does this programmatically using patchwork.

For anyone interested, I settled on using geom_segment and clip = "off" in coord_cartesian(). I'm sure there's a way to generalize this so its not so manual. It is a little finicky to plot size...

library(tidyverse)
  set1 = tribble(
    ~phase, ~session, ~outcome,
    "baseline", 1, 0,
    "baseline", 2, 10,
    "baseline", 3, 10,
    "baseline", 4, 0,
    "baseline", 5, 0,
    "treatment", 6, 20,
    "treatment", 7, 30,
    "treatment", 8, 40,
    "treatment", 9, 40, 
    "treatment", 10, 50,
    "treatment", 11, 60,
    "treatment", 12, 80,
    "treatment", 13, 90,
    "treatment", 15, 90,
    "treatment", 17, 80,
    "treatment", 19, 100,
    "treatment", 21, 90
  ) %>% mutate(set = "set1")
  
  set2 = tribble(
    ~phase, ~session, ~outcome,
    "baseline", 1, 10,
    "baseline", 2, 10,
    "baseline", 3, 10,
    "baseline", 4, 5,
    "baseline", 5, 0,
    "baseline", 6, 10,
    "baseline", 7, 10,
    "baseline", 8, 10,
    "baseline", 9, 5, 
    "baseline", 10, 0,
    "baseline", 11, 10,
    "baseline", 12, 10,
    "baseline", 13, 10,
    "treatment", 14, 20,
    "treatment", 15, 30,
    "treatment", 16, 40,
    "treatment", 17, 50,
    "treatment", 18, 50,
    "treatment", 19, 70,
    "treatment", 20, 80,
    "treatment", 21, 90
  ) %>% mutate(set = "set2")
  
  dat = bind_rows(set1, set2)
  
  lines = tibble(
    set = c("set1","set2"),
    line = c(5.5, 13.5)
  )
  
  dat %>%
    ggplot(aes(x = session, y = outcome, group = phase)) +
    geom_line() + 
    geom_point() +
    geom_segment(data = lines, inherit.aes = F, aes(x = line, xend = line, y = 0, yend = 100)) + 
    lemon::facet_rep_grid(set~., repeat.tick.labels = T) +
    scale_x_continuous(minor_breaks = seq(1, 25, 1), breaks = c(1, 5, 10, 15, 20, 25)) +
    theme_bw(base_size = 14) +
    coord_cartesian( ylim = c(0, 100), clip = 'off') +
    geom_segment(data = tibble(set = "set1", x = 5.5, xend = 13.5),
                 inherit.aes = F,
                 aes(x = x, y = 0, xend = xend, yend = 0)) +
    geom_segment(data = tibble(set = "set1", x = 13.5, xend = 13.5),
                 inherit.aes = F,
                 aes(x = x, y = 0, xend = xend, yend = -15)) +
    geom_segment(data = tibble(set = "set2", x = 13.5, xend = 13.5),
                 inherit.aes = F,
                 aes(x = x, y = 100, xend = xend, yend = 115))

Created on 2022-04-06 by the reprex package (v2.0.1)

This topic was automatically closed 21 days after the last reply. New replies are no longer allowed.

If you have a query related to it or one of the replies, start a new topic and refer back with a link.