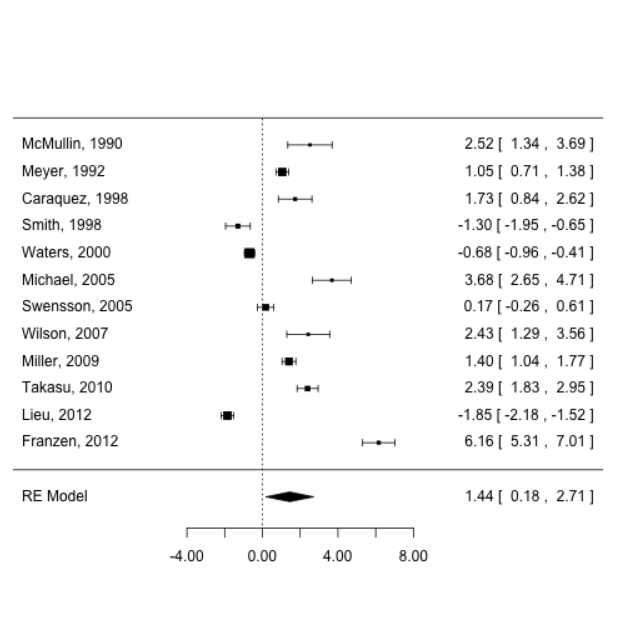
HI, I am doing meta-analysis with around 100 dependent variables by metafor package. I want to plot the effect size and random effect in a forest plot. For that, I am following a tutorial where it has shown a forest plot for a single dependent variable generating a plot like this:
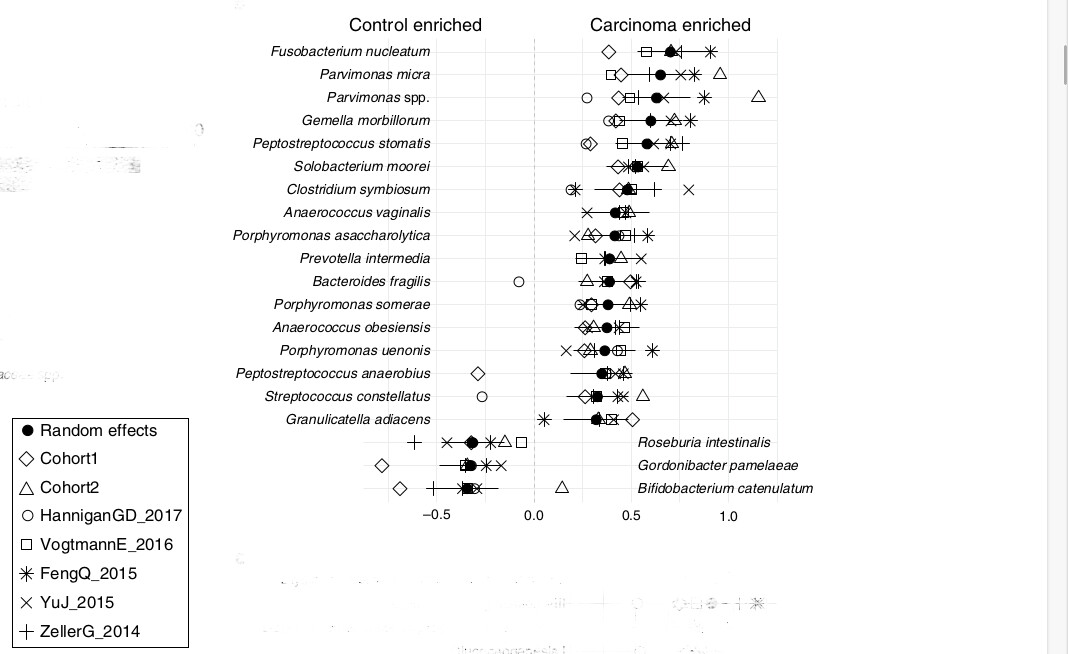
I want to condense this forest plot so that bars for each study and the RE Model (Random Effect)overlap in a single line and show them with legend, something like this:

After that I will run the code in loop for my 100 dependent variables in order to get a plot like this:
Can anyone please help me doing this?
Many thanks