How can I color code a region in static map?

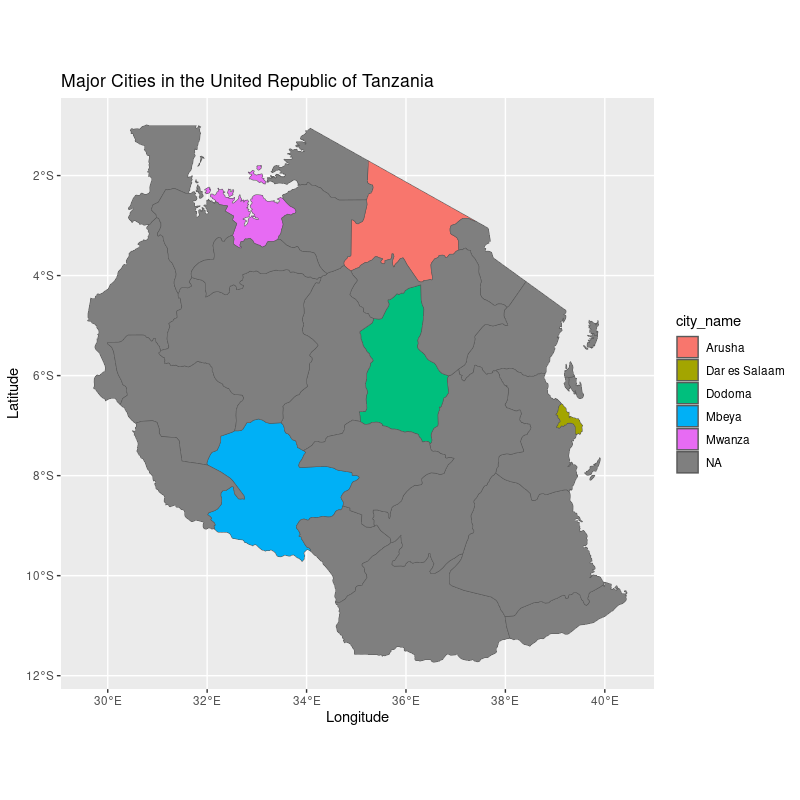
I need help figuring out how to color code a map using coordinates ? If possible, i did research but I couldn't find code to help me. Below in the code I mapped several cities of a country and I need help with a code that would allow me to color the different area where the cities are located.
(if thats not possible, how can I change the color of the cities name, so each city has a different color name instead of all being blue)

library(sf) #'simple features' package
library(leaflet) # web-embeddable interactive maps
library(ggplot2) # general purpose plotting
library(rnaturalearth) # map data
library(rnaturalearthdata)# map data
library(ggspatial) # scale bars and north arrows

#the package below was installed from source through github: 
# devtools::install_github("ropensci/rnaturalearthhires"))
library(rnaturalearthhires)# map data 

theme_set(theme_bw())

city_data <- data.frame(city_name=c("Dar es Salaam", "Mwanza", "Arusha", "Dodoma", "Mbeya"))
city_data$lat <- c(-6.7924,-2.5164,-3.3869,-6.1630,-8.9094)
city_data$lon <- c(39.2083,32.9175,36.6830,35.7516,33.4608)

ggplot(data = tanzania) +
    geom_sf() +
    xlab("Longitude") + ylab("Latitude") +
    ggtitle("Major Cities in the United Republic of Tanzania") +
    annotation_scale(location = "bl", width_hint = 0.4) +
    annotation_north_arrow(location = "bl", which_north = "true", 
        pad_x = unit(0.0, "in"), pad_y = unit(0.2, "in"),
        style = north_arrow_fancy_orienteering) +
  geom_point(data = city_data, mapping = aes(x = lon, y = lat), colour = "red") +
  geom_text(data = city_data, mapping=aes(x=lon, y=lat, label=city_name), nudge_y = 0.5, color="darkblue"

The code you provided doesn't seem to reproduce - the tanzania object you refer to in the first line of the ggplot call is not exported from any of the packages you import.

Which is a problem that can be helped, but please give us an idea what kind of areas you want to color code; specifically: do you need to color code polygons of some admin units (I am unsure how these are called in Tanzania - states? districts?)

In the following code I will assume you want to color code the level 1 admin areas - Tanzania has about 30 of these, so it will feel about OK for a map.

The technique that the code uses is spatial join - combining polygons as admin areas and cities as points based on intersection (= which point is in which polygon). This will give admin area polygons the atributes of cities - such as city_name. The function to perform a spatial join is sf::st_join().

In order for the spatial join to work both the admin area polygons have to be in {sf} package format and in compatible Coordinate Reference System; which is where the sf::st_as_sf() comes from.

I have also taken the liberty of removing code not directly related to joining the cities to admin areas + plotting the result for the sake of clarity and concise code.

library(sf) #'simple features' package
library(ggplot2) # general purpose plotting
library(rnaturalearth) # map data

city_data <- data.frame(city_name=c("Dar es Salaam", "Mwanza", "Arusha", "Dodoma", "Mbeya"))
city_data$lat <- c(-6.7924,-2.5164,-3.3869,-6.1630,-8.9094)
city_data$lon <- c(39.2083,32.9175,36.6830,35.7516,33.4608)

# convert city_data from regular data frame to sf data frame
city_data_sf <- st_as_sf(city_data, crs = 4326, coords = c("lon", "lat"))

# declare tanzania object as admin areas of Tanzania
tanzania <- rnaturalearth::ne_states(iso_a2 = 'TZ', returnclass = 'sf')

# spatially join tanzania admin areas to cities as sf object
tanzania_joined <- st_join(tanzania, city_data_sf)

ggplot() +
  geom_sf(data = tanzania_joined, aes(fill = city_name)) +
  xlab("Longitude") + ylab("Latitude") +
  ggtitle("Major Cities in the United Republic of Tanzania") 

This topic was automatically closed 21 days after the last reply. New replies are no longer allowed.

If you have a query related to it or one of the replies, start a new topic and refer back with a link.