How can i adjust the errorbars on the stacked barplot?

Hello everyone...
I am a master student stuck in a problem for half a day...

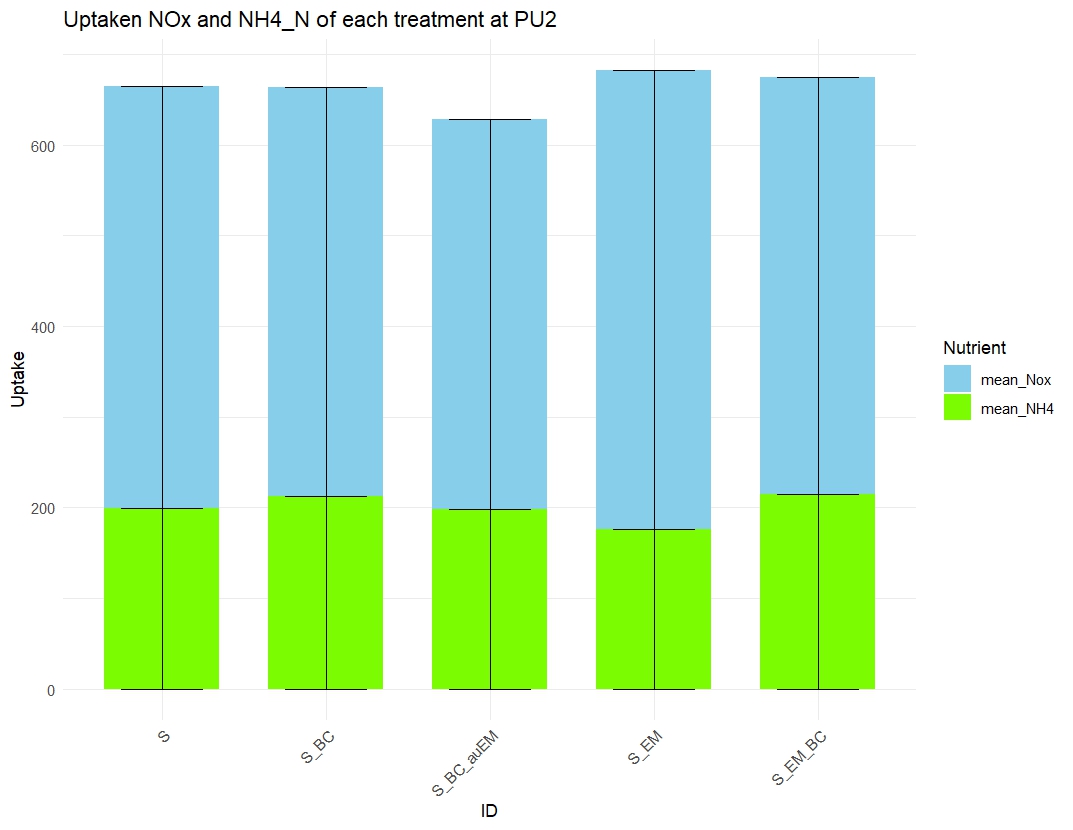
I am making a bar plot with the error bars.
I have 2 values which are NOx and NH4_N.
And there are 5 IDs which are S, S_BC, S_EM, S_BC_auEM, and S_EM_BC.

For the bar plot, I want to include NOx and NH4 data in one bar to indicate the Total N uptake. However, the inclusion of the bar worked quite well, but the error bar problem could not be solved.
like the are not stacked or looks so weird like here.

The code is the following...

####Trial
### Uptaken N - Pu2
# Calculate mean and standard error for Uptook_Nox and Uptook_NH4_N by ID

summary_stats_pu2 <- data_1_sub_tray_Pu2 %>%
  group_by(ID) %>%
  summarise(mean_Nox = mean(Uptook_Nox),
            mean_NH4 = mean(Uptook_NH4_N),
            se_Nox = sd(Uptook_Nox) / sqrt(n()),
            se_NH4 = sd(Uptook_NH4_N) / sqrt(n()))

# Reshape data for plotting
plot_data_pu2 <- summary_stats_pu2 %>%
  pivot_longer(cols = c(mean_Nox, mean_NH4), names_to = "Nutrient", values_to = "Mean") %>%
  mutate(Error = ifelse(Nutrient == "mean_Nox", se_Nox, se_NH4),
         Nutrient = factor(Nutrient, levels = c("mean_NH4", "mean_Nox")))  # Ensure NH4 is on top

# Plotting stacked bar chart with error bars
ggplot(plot_data_pu2, aes(x = ID, y = Mean, fill = Nutrient)) +
  geom_bar(stat = "identity", position = position_stack(reverse = TRUE), width = 0.7) +
  geom_errorbar(aes(ymin = Mean - Error, ymax = Mean + Error), 
                position = position_stack(reverse = TRUE, vjust = 0.5), width = 0.5,  # Adjust position and width
                size = 0.5, color = "black") +  # Adjust error bar aesthetics
  labs(x = "ID", y = "Uptake", fill = "Nutrient",
       title = "Uptaken NOx and NH4_N of each treatment at PU2") +
  theme_minimal() +
  theme(axis.text.x = element_text(angle = 45, hjust = 1)) +
  scale_fill_manual(values = c("mean_NH4" = "#7CFC00", "mean_Nox" = "skyblue")) +  # Custom fill colors
  guides(fill = guide_legend(reverse = TRUE))  # Reverse legend order to match stack order

What should I change to make the error bar proper?
Your idea will be highly appreciated... thank you in advance!

position stack() will expand the error bars to 100% of height. position_dodge() does work But there is no need to stack the error bars f you calculate the cumulative means grouped by ID, like this:

library(tidyverse)

data_1_sub_tray_Pu2 <- data.frame(
  ID = sample(c("S", "S_BC", "S_BC_auEM", "S_EM", "S_EM_BC"), 100, replace = TRUE),
  Uptook_Nox = runif(100, 0, 1),
  Uptook_NH4_N = runif(100, 0, 1)
)
  
summary_stats_pu2 <- data_1_sub_tray_Pu2 %>%
  group_by(ID) %>%
  summarise(mean_Nox = mean(Uptook_Nox),
            mean_NH4 = mean(Uptook_NH4_N),
            se_Nox = sd(Uptook_Nox) / sqrt(n()),
            se_NH4 = sd(Uptook_NH4_N) / sqrt(n()))

plot_data_pu2 <- summary_stats_pu2 %>%
  pivot_longer(cols = c(mean_Nox, mean_NH4), names_to = "Nutrient", values_to = "Mean") %>%
  mutate(Error = ifelse(Nutrient == "mean_Nox", se_Nox, se_NH4),
         Nutrient = factor(Nutrient, levels = c("mean_NH4", "mean_Nox"))) %>% 
  arrange(ID, rev(Nutrient)) %>% 
  mutate(.by = ID, MeanCum = cumsum(Mean)) 

ggplot(plot_data_pu2, aes(x = ID, y = Mean, fill = Nutrient)) +
  geom_bar(stat = "identity", position = position_stack(), width = 0.7) +
  geom_errorbar(aes(ymin = MeanCum - Error, ymax = MeanCum + Error),
                width = 0.5, # Adjust position and width
                size = 0.5, color = "black") +
  labs(x = "ID", 
       y = "Uptake", 
       fill = "Nutrient",
       title = "Uptaken NOx and NH4_N of each treatment at PU2"
       ) +
  theme_minimal() +
  theme(axis.text.x = element_text(angle = 45, hjust = 1)) +
  scale_fill_manual(values = c("mean_NH4" = "#7CFC00", "mean_Nox" = "skyblue")) + 
  guides(fill = guide_legend(reverse = TRUE)) 

1 Like

Hi @Sunah ,

Thank you for sharing the code you used — would you mind sharing the data as well so that it's easier for folks here to help? You can do that by first running:

dput(head(data_1_sub_tray_Pu2, 100))

and sharing the output here in a code block.