How can I add tags to this graphic?

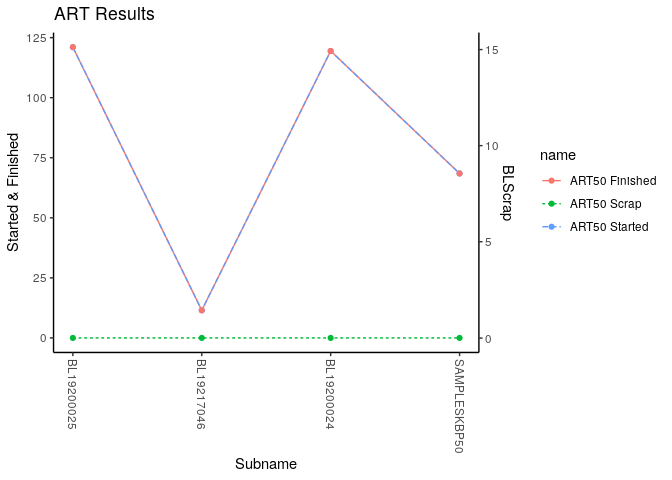
I am very new to R and I have a question, how can I label this graphic? I already tried in several ways but I can't make them visible.
I need to add the label of each line are 2
A red, blue and green.
and I also need the example name to appear
ART50 inside the tag.

library(ggplot2)
library(tidyverse)
library(dplyr)
#dataset
name <- c("ART50","ART50","ART50","ART50")
subname <- c("BL19200025","BL19217046","BL19200024","SAMPLESKBP50")
lotacc <- c(1,1,1,1)
Started	<-c(11.49,119.45,121.05,68.46)
Scrap	<-c(0,0,0,0)
Finished<-c(11.49,119.45,121.05,68.46)

dataset <- data.frame(name,subname,lotacc,Started,Finished,Scrap)

#dataset%>%
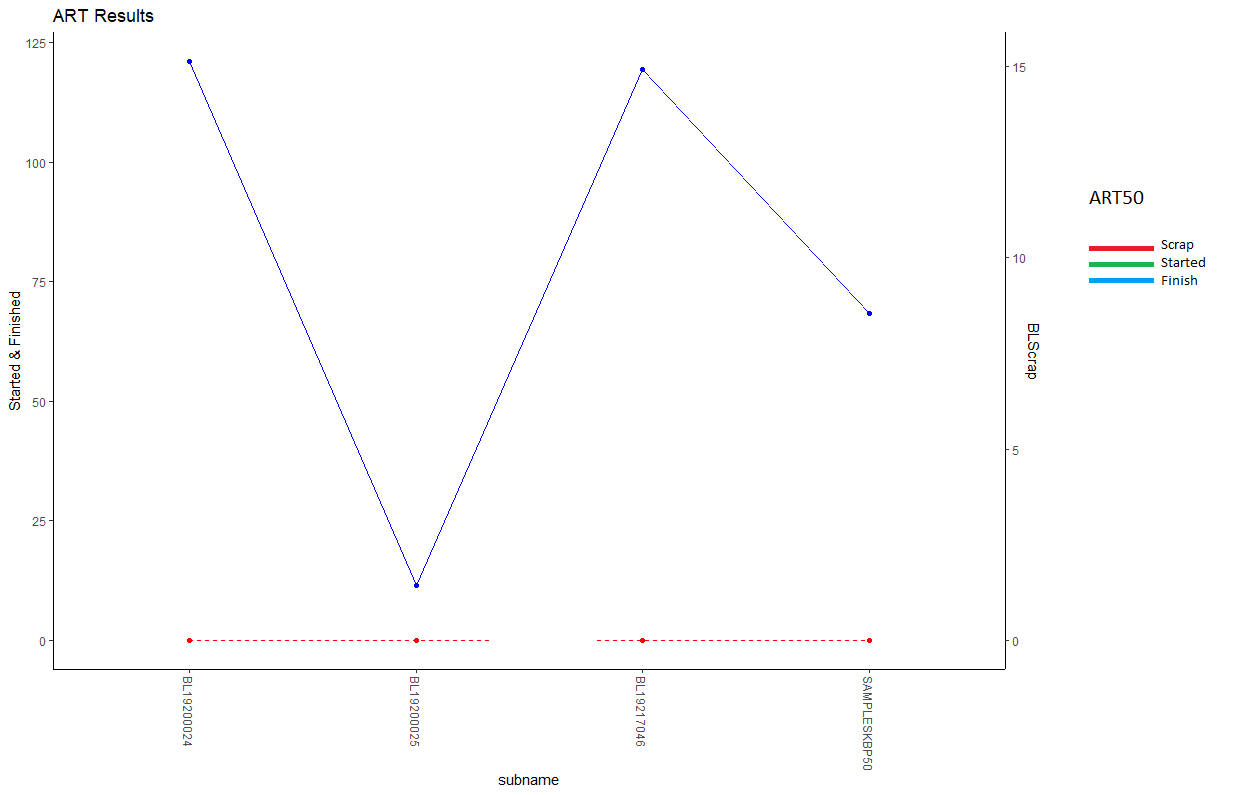
ggplot(dataset)+  #Geom_Line de BLScrap
  geom_line(mapping = aes(x = subname, y = Scrap*8, group = name),col = "Red",linetype = "dashed")+
  geom_point(mapping = aes(x = subname, y = Scrap*8),col = "Red")+scale_y_continuous("Started & Finished",sec.axis = sec_axis(~ ./8, name = "BLScrap"))+
  #Geom_Line de BLAmountStarted
  geom_line(mapping = aes(x = subname, y = Started, group = name), col = "green")+
  geom_point(mapping = aes(x = subname, y = Started, group = name), col = "Green")+
  #Geom_Line de BLAmountFinished
  geom_line(mapping = aes(x = subname, y = Finished, group = name), col = "Blue")+
  geom_point(mapping = aes(x = subname, y = Finished), col = "Blue")+
  #Style
  theme_classic()+theme(axis.text.x=element_text(angle=-90, vjust=0.5, hjust=0))+
  labs(title = "ART Results")

I enclose an example image.

Sorry your description is not very clear, is this what you mean?

library(tidyverse)

dataset <- data.frame(
      lotacc = c(1, 1, 1, 1),
     Started = c(11.49, 119.45, 121.05, 68.46),
    Finished = c(11.49, 119.45, 121.05, 68.46),
       Scrap = c(0, 0, 0, 0),
        name = as.factor(c("ART50", "ART50", "ART50", "ART50")),
     subname = as.factor(c("BL19200025",
                           "BL19217046","BL19200024","SAMPLESKBP50"))
)

dataset %>%
    mutate(Scrap = Scrap * 8) %>% 
    gather(group, value, c(Scrap, Started, Finished)) %>% 
    mutate(name = paste(name, group)) %>% 
    ggplot(aes(x = as.numeric(subname), y = value, color = name, linetype = name)) +
    geom_line() +
    geom_point() +
    scale_x_continuous(labels = as.character(dataset$subname)) +
    scale_y_continuous("Started & Finished",sec.axis = sec_axis(~ ./8, name = "BLScrap")) +
    theme_classic() +
    theme(axis.text.x = element_text(angle=-90, vjust=0.5, hjust=0)) +
    labs(title = "ART Results",
         x = "Subname")

Created on 2020-01-23 by the reprex package (v0.3.0.9000)

Hi @andresrcs

wanting to adapt it to my data this message appears

Error: Aesthetics must be either length 1 or the same as the data (12): x

I already looked at my mistake, you can modify it, but at the time of changing the data for others, bone, name, and subname I get this error.
Error in f(..., self = self) : Breaks and labels are different lengths

I would need sample data that reproduces this issue in order to help you.

these would be the new sample data
where

name <- powdername
lotname <- subname
lotacc <- BLYieldlote
Started <- BLAmountStated
scrap <- BLScrap
finished <- BLAAmountFinished

image

Sorry but where is the sample data? I can only see a screenshot and I can't copy from that.

Sorry, In a moment he transformed them, give me a moment.

dataset <- data.frame(
  lotacc = c(1, 1, 1, 1,1,0.84,0.938),
  Started = c(14.28,20.16,37.39,83.66,95.4,104.8,104.8),
  Finished = c(14.28,20.16,37.39,83.66,95.4,88,98.3),
  Scrap = c(0,0, 0, 0, 0,16.8,6.5),
  name = as.factor(c("KBP82", "KBP82", "KBP82", "KBP82","KBP82","KBP82","KBP82")),
  subname = as.factor(c("BL17299425","BL18023812","BL18353300","BL19197009","EMBL19023001","EMBL19351646","EMBL19333591"))
)

Is this what you want?

library(tidyverse)

dataset <- data.frame(
    lotacc = c(1, 1, 1, 1, 1, 0.84, 0.938),
    Started = c(14.28,20.16,37.39,83.66,95.4,104.8,104.8),
    Finished = c(14.28,20.16,37.39,83.66,95.4,88,98.3),
    Scrap = c(0,0, 0, 0, 0,16.8,6.5),
    name = as.factor(c("KBP82", "KBP82", "KBP82", "KBP82","KBP82","KBP82","KBP82")),
    subname = as.factor(c("BL17299425","BL18023812","BL18353300","BL19197009","EMBL19023001","EMBL19351646","EMBL19333591"))
)

dataset %>%
    mutate(Scrap = Scrap * 8) %>% 
    gather(group, value, c(Scrap, Started, Finished)) %>% 
    mutate(name = paste(name, group)) %>% 
    ggplot(aes(x = as.numeric(subname), y = value, color = name, linetype = name)) +
    geom_line() +
    geom_point() +
    scale_x_continuous(breaks = as.numeric(dataset$subname),
                       labels = as.character(dataset$subname)) +
    scale_y_continuous("Started & Finished",sec.axis = sec_axis(~ ./8, name = "BLScrap")) +
    theme_classic() +
    theme(axis.text.x = element_text(angle=-90, vjust=0.5, hjust=0)) +
    labs(title = "ART Results",
         x = "Subname")

Created on 2020-01-24 by the reprex package (v0.3.0.9000)

If it isn't, maybe you could try to DM me an explain your issue in Spanish because honestly, I'm having problems understanding what you are writing.

1 Like

@andresrcs
My God, for all saints!
It is just what I need!
I really appreciate it too much!
Thank you very much for your help, time and dedication!

This topic was automatically closed 7 days after the last reply. New replies are no longer allowed.