Hi all,
I am struggling with a ggplot and the hovering. How do I only hover on the size, and not have the trace number show up, as shown in the screenshot below? Any insight into how to solve this would be much appreciated. Thank you in advance!
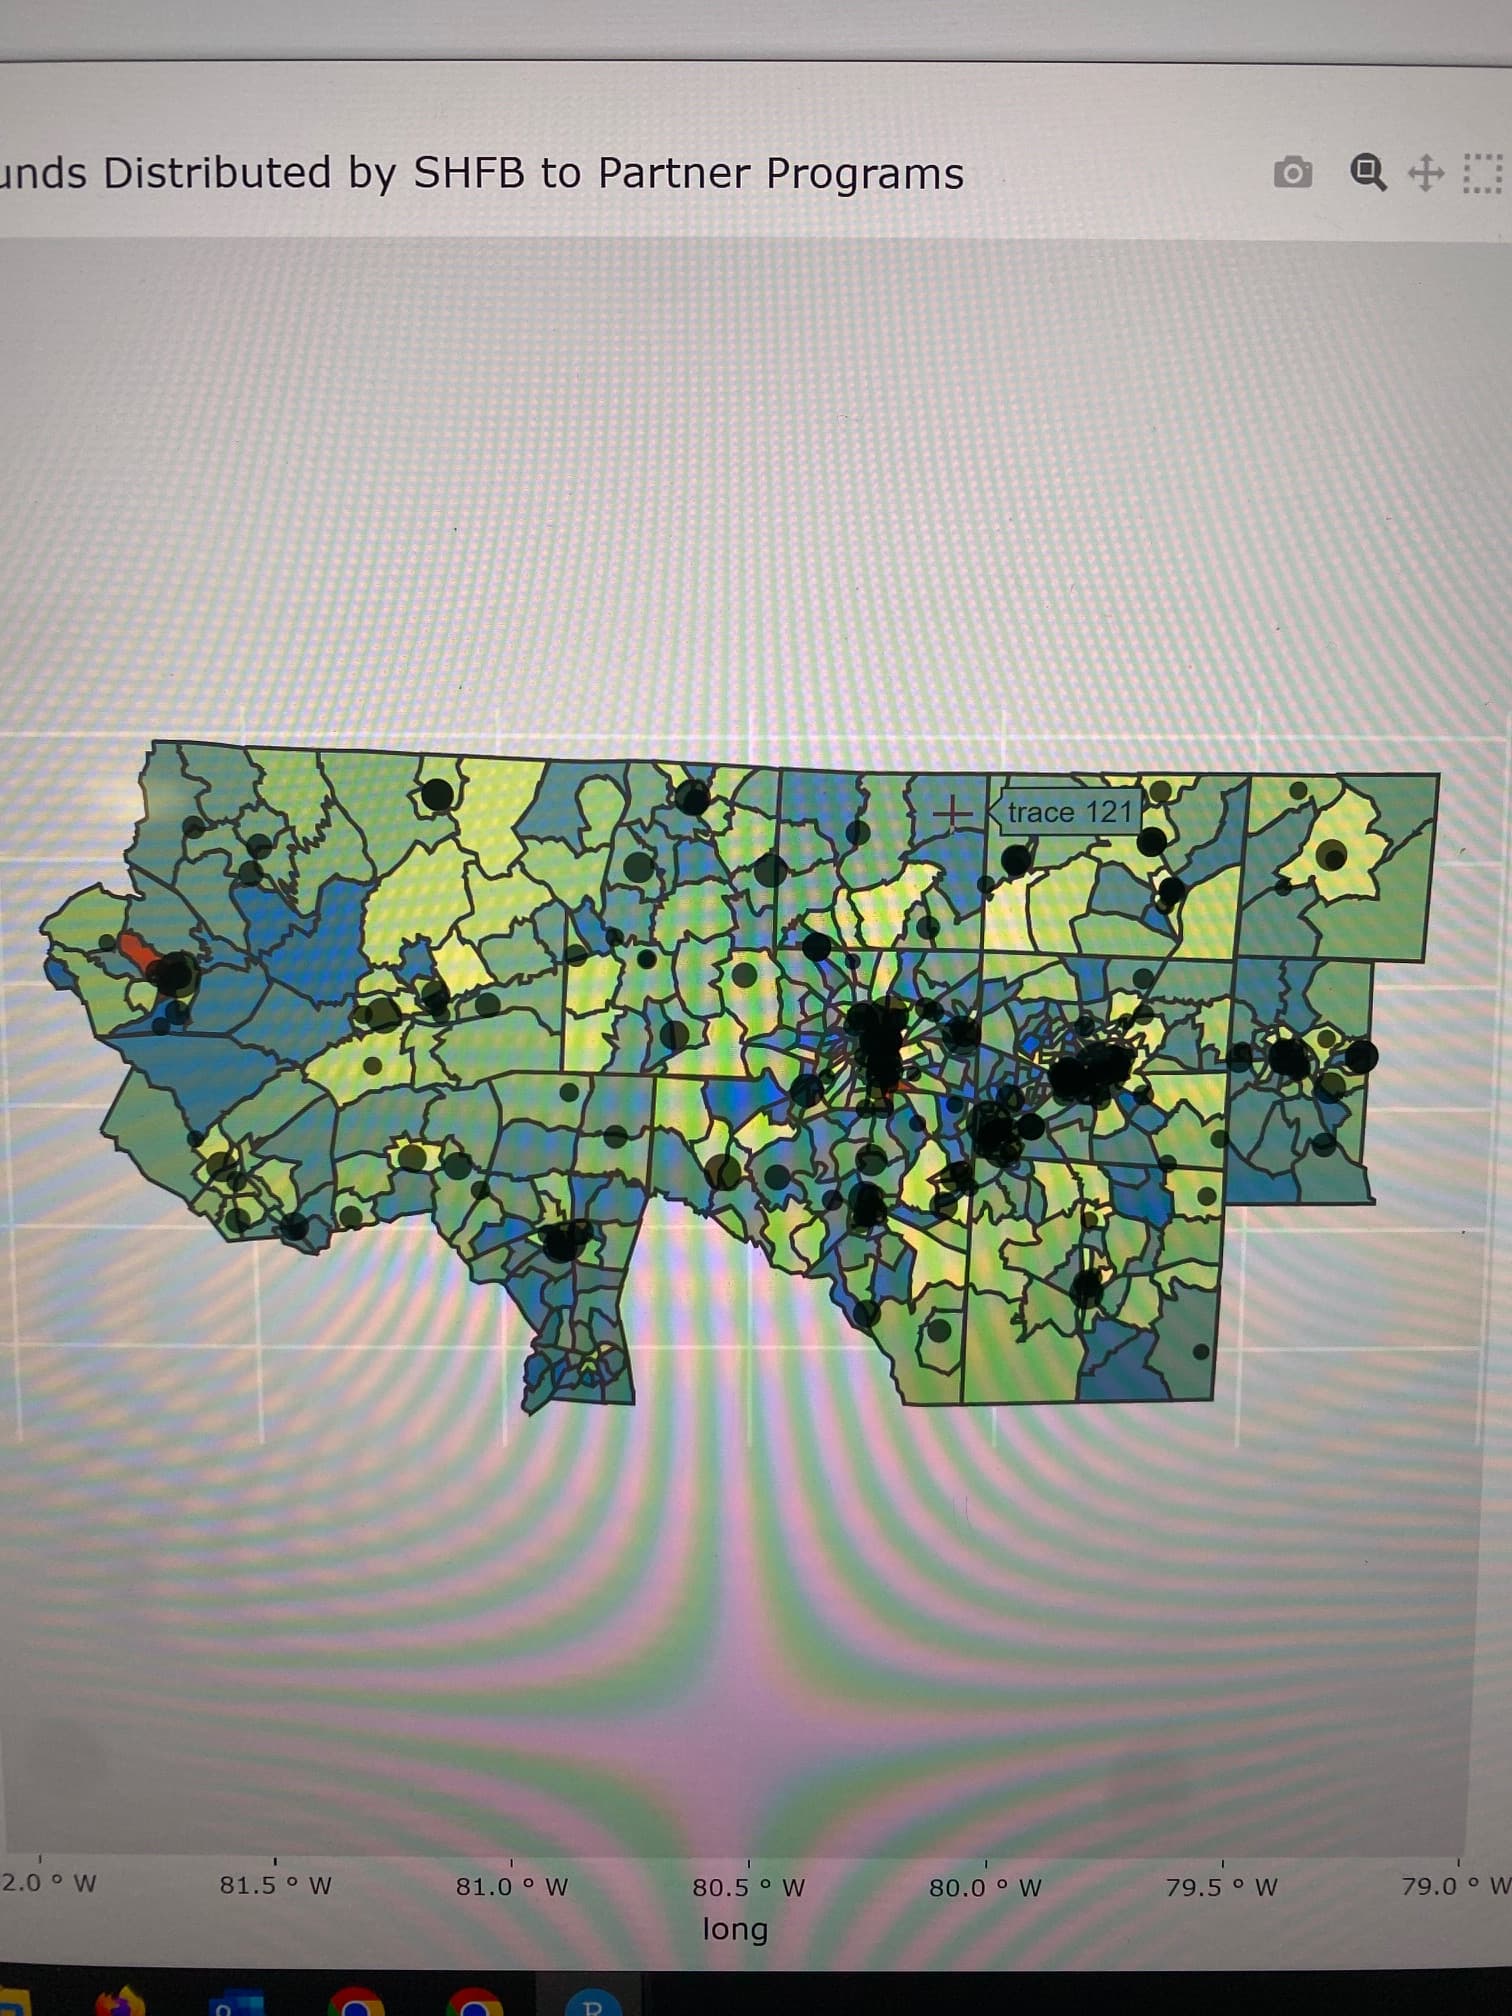
This image shows the trace, that I don't want:
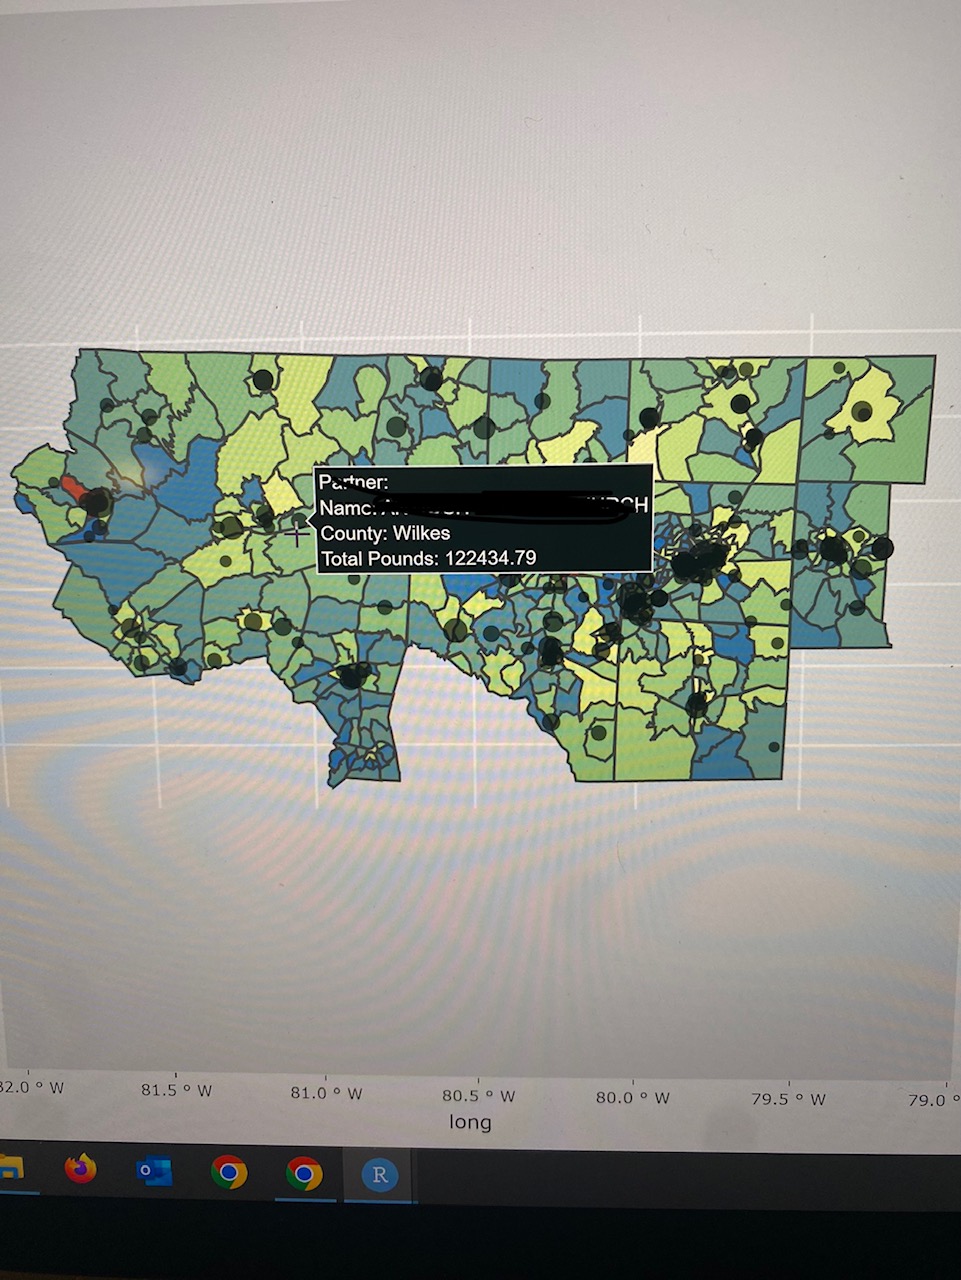
This image shows the correct hover information:
Ideally, hovering on the census tracts, which are a heat map as shown in the image, would show the NumbImpoverished, in the aes() in the geom_sf() code, for that specific tract. However, I spent a lot of time trying to figure that out and was unsuccessful. Let me know what you think. Thanks again.
    pounds_plot <- ggplot() +
      geom_sf(data = full_pov_census_data, aes(fill = NumbImpoverished)) +
      geom_point(data = link2feed_partner_data, aes(x = long, y = lat, size = Total, alpha = 1, label = Partner)) +
      ggtitle("Pounds Distributed by SHFB to Partner Programs") +
      scale_fill_distiller(palette = "Spectral", name = "Number Impoverished")

     ggplotly(pounds_plot, tooltip = "label") %>%
       layout(height = 800) %>%
       style(hoveron = "size")