Horizontal zig-zag when I do a vertical dodge on my line plot (do NOT want!)

Here's my question:
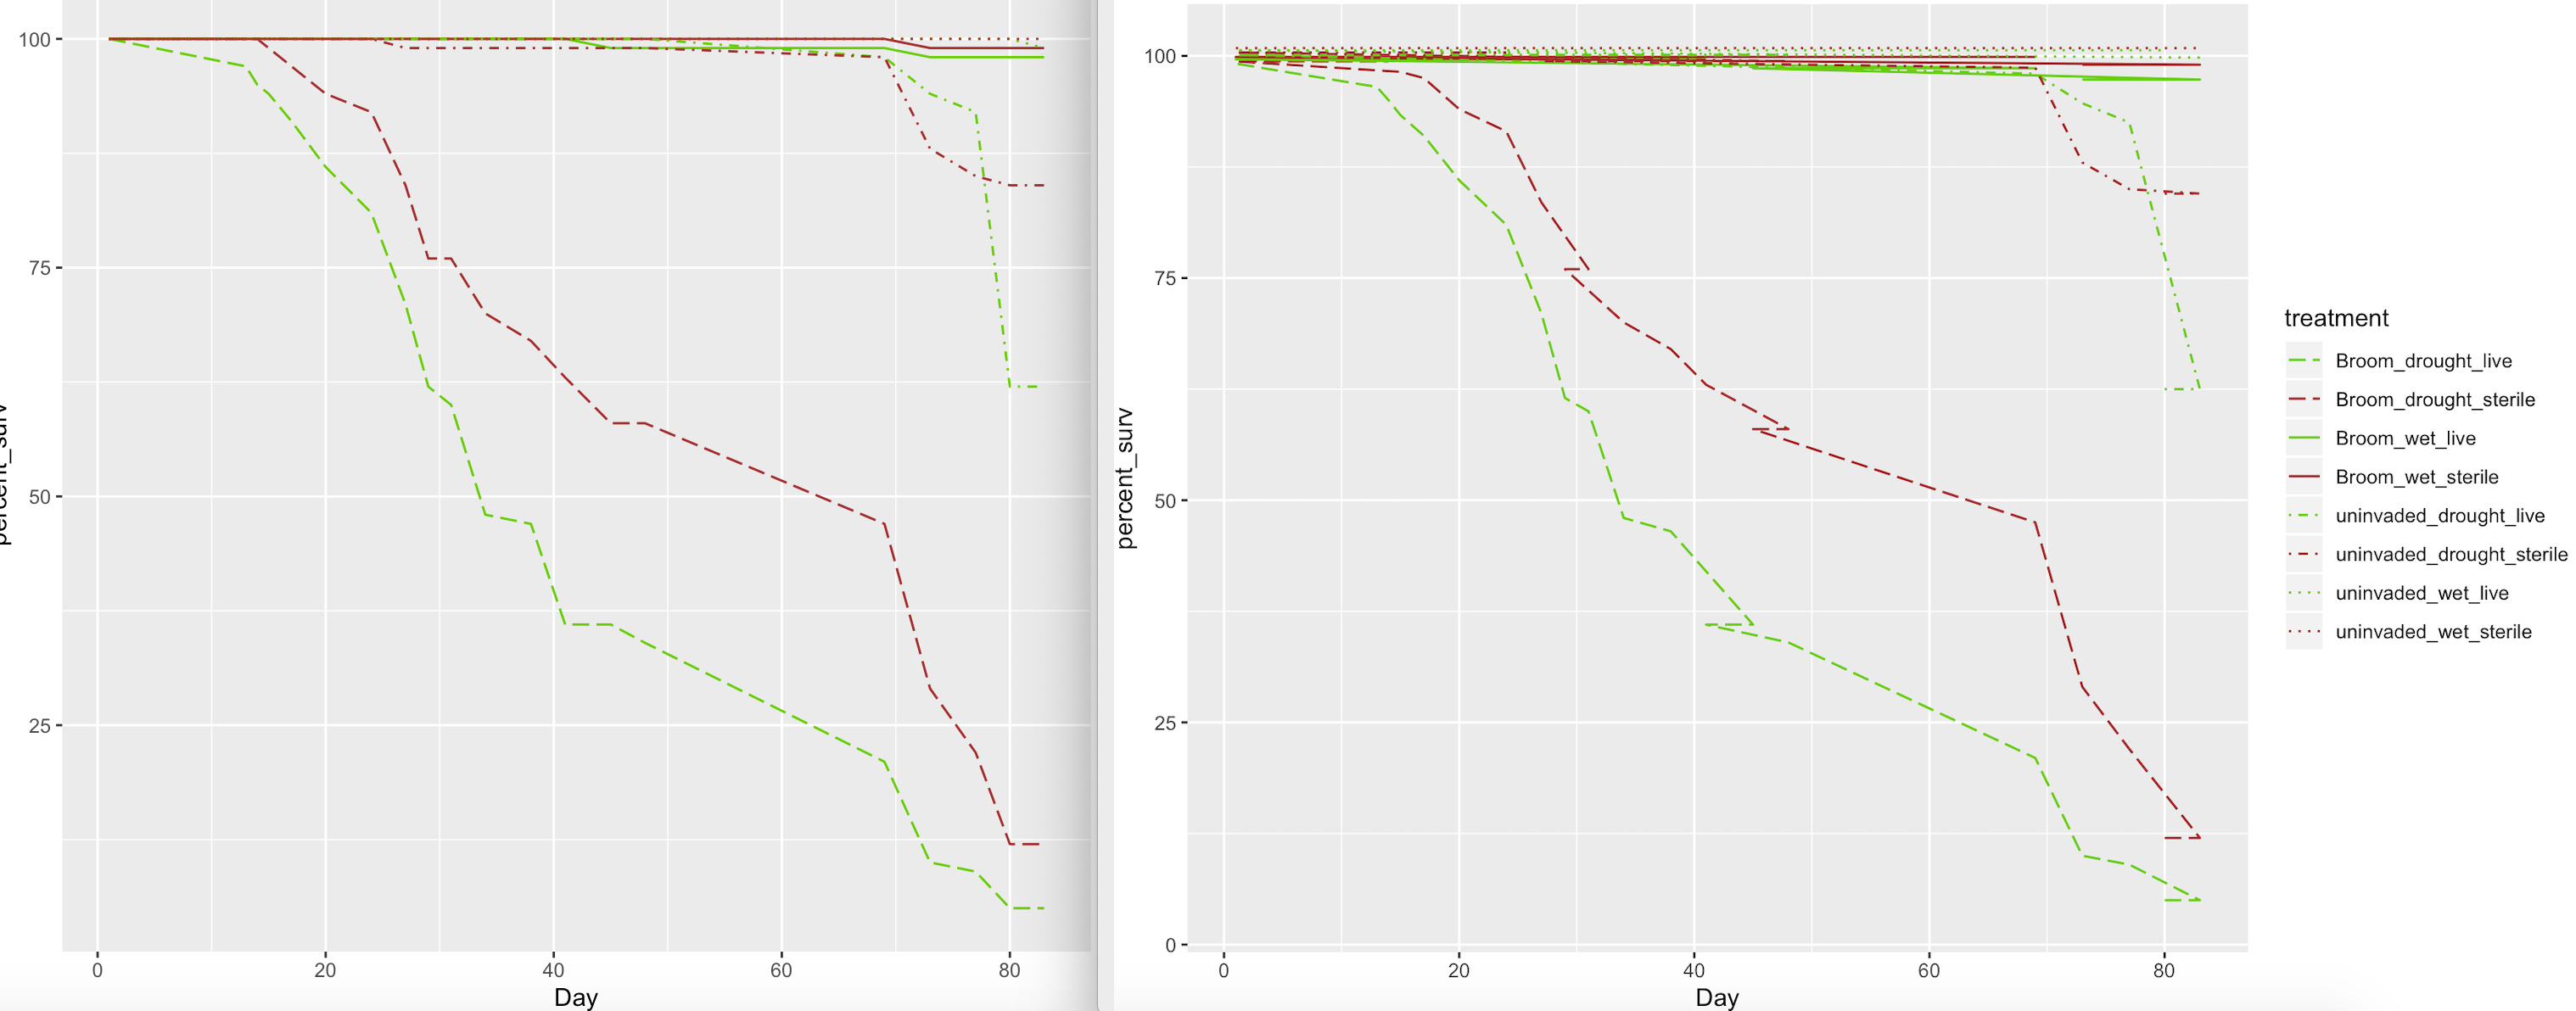
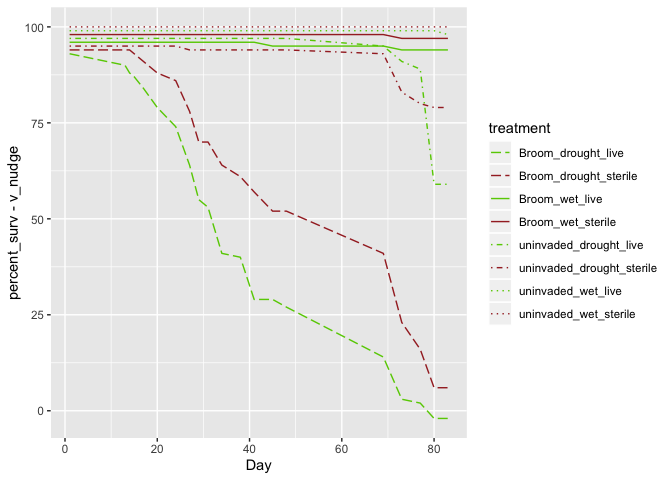
When I do a vertical dodge on my line graph, I get this weird horizontal shift on the spaces between 2 datapoints that were equal in y value but not in their x value (any time the lines go flat, they do a zig-zag when I apply a vertical dodge to my graph). Can anybody help me solve this issue?

Here's my data and code

dput(cont_surv)
structure(list(Day = c(1L, 13L, 14L, 15L, 17L, 20L, 24L, 27L, 
29L, 31L, 34L, 38L, 41L, 45L, 48L, 69L, 73L, 77L, 80L, 83L, 1L, 
13L, 14L, 15L, 17L, 20L, 24L, 27L, 29L, 31L, 34L, 38L, 41L, 45L, 
48L, 69L, 73L, 77L, 80L, 83L, 1L, 13L, 14L, 15L, 17L, 20L, 24L, 
27L, 29L, 31L, 34L, 38L, 41L, 45L, 48L, 69L, 73L, 77L, 80L, 83L, 
1L, 13L, 14L, 15L, 17L, 20L, 24L, 27L, 29L, 31L, 34L, 38L, 41L, 
45L, 48L, 69L, 73L, 77L, 80L, 83L, 1L, 13L, 14L, 15L, 17L, 20L, 
24L, 27L, 29L, 31L, 34L, 38L, 41L, 45L, 48L, 69L, 73L, 77L, 80L, 
83L, 1L, 13L, 14L, 15L, 17L, 20L, 24L, 27L, 29L, 31L, 34L, 38L, 
41L, 45L, 48L, 69L, 73L, 77L, 80L, 83L, 1L, 13L, 14L, 15L, 17L, 
20L, 24L, 27L, 29L, 31L, 34L, 38L, 41L, 45L, 48L, 69L, 73L, 77L, 
80L, 83L, 1L, 13L, 14L, 15L, 17L, 20L, 24L, 27L, 29L, 31L, 34L, 
38L, 41L, 45L, 48L, 69L, 73L, 77L, 80L, 83L), percent_surv = c(100L, 
97L, 95L, 94L, 91L, 86L, 81L, 71L, 62L, 60L, 48L, 47L, 36L, 36L, 
34L, 21L, 10L, 9L, 5L, 5L, 100L, 100L, 100L, 99L, 97L, 94L, 92L, 
84L, 76L, 76L, 70L, 67L, 63L, 58L, 58L, 47L, 29L, 22L, 12L, 12L, 
100L, 100L, 100L, 100L, 100L, 100L, 100L, 100L, 100L, 100L, 100L, 
100L, 100L, 99L, 99L, 99L, 98L, 98L, 98L, 98L, 100L, 100L, 100L, 
100L, 100L, 100L, 100L, 100L, 100L, 100L, 100L, 100L, 100L, 100L, 
100L, 100L, 99L, 99L, 99L, 99L, 100L, 100L, 100L, 100L, 100L, 
100L, 100L, 100L, 100L, 100L, 100L, 100L, 100L, 100L, 100L, 98L, 
94L, 92L, 62L, 62L, 100L, 100L, 100L, 100L, 100L, 100L, 100L, 
99L, 99L, 99L, 99L, 99L, 99L, 99L, 99L, 98L, 88L, 85L, 84L, 84L, 
100L, 100L, 100L, 100L, 100L, 100L, 100L, 100L, 100L, 100L, 100L, 
100L, 100L, 100L, 100L, 100L, 100L, 100L, 100L, 99L, 100L, 100L, 
100L, 100L, 100L, 100L, 100L, 100L, 100L, 100L, 100L, 100L, 100L, 
100L, 100L, 100L, 100L, 100L, 100L, 100L), treatment = structure(c(1L, 
1L, 1L, 1L, 1L, 1L, 1L, 1L, 1L, 1L, 1L, 1L, 1L, 1L, 1L, 1L, 1L, 
1L, 1L, 1L, 2L, 2L, 2L, 2L, 2L, 2L, 2L, 2L, 2L, 2L, 2L, 2L, 2L, 
2L, 2L, 2L, 2L, 2L, 2L, 2L, 3L, 3L, 3L, 3L, 3L, 3L, 3L, 3L, 3L, 
3L, 3L, 3L, 3L, 3L, 3L, 3L, 3L, 3L, 3L, 3L, 4L, 4L, 4L, 4L, 4L, 
4L, 4L, 4L, 4L, 4L, 4L, 4L, 4L, 4L, 4L, 4L, 4L, 4L, 4L, 4L, 5L, 
5L, 5L, 5L, 5L, 5L, 5L, 5L, 5L, 5L, 5L, 5L, 5L, 5L, 5L, 5L, 5L, 
5L, 5L, 5L, 6L, 6L, 6L, 6L, 6L, 6L, 6L, 6L, 6L, 6L, 6L, 6L, 6L, 
6L, 6L, 6L, 6L, 6L, 6L, 6L, 7L, 7L, 7L, 7L, 7L, 7L, 7L, 7L, 7L, 
7L, 7L, 7L, 7L, 7L, 7L, 7L, 7L, 7L, 7L, 7L, 8L, 8L, 8L, 8L, 8L, 
8L, 8L, 8L, 8L, 8L, 8L, 8L, 8L, 8L, 8L, 8L, 8L, 8L, 8L, 8L), .Label = c("Broom_drought_live", 
"Broom_drought_sterile", "Broom_wet_live", "Broom_wet_sterile", 
"uninvaded_drought_live", "uninvaded_drought_sterile", "uninvaded_wet_live", 
"uninvaded_wet_sterile"), class = "factor")), class = "data.frame", row.names = c(NA, 
-160L))

and my code


ggplot(cont_surv, 
       aes(
          x=Day,
          y=percent_surv,
          group = treatment,
          xlab = "Days since drought treatment start",
          ylab = "Percent surviving"
        )
 )+
   geom_line(aes(linetype=treatment,
                 color = treatment
   ),  position=position_dodgev(height=2)
) +
   
   scale_linetype_manual(values= c(5,5,1,1,4,4,3,3)
 )+
   scale_color_manual(values=c(
     "chartreuse3", 
     "brown", 
     "chartreuse3",
     "brown",
     "chartreuse3",
     "brown",
     "chartreuse3",
     "brown"
   ))+
   scale_size_manual(values=c(1,1.5))

Hi @erinaiello: Are you sure you're posting the code you're using? When I try it, it doesn't run without errors. Could you try the code you pasted and confirm that it works for you?

You are posting code with the same error as your previous post, take the position argument out of the aes() function.

Also, can you turn this into a proper self-contained REPRoducible EXample (reprex) illustrating your issue?

I think this might be like what you're after, but it's specific to this data not a general solution:

library(tidyverse)
cont_surv <- 
  structure(list(Day = c(1L, 13L, 14L, 15L, 17L, 20L, 24L, 27L, 
                         29L, 31L, 34L, 38L, 41L, 45L, 48L, 69L, 73L, 77L, 80L, 83L, 1L, 
                         13L, 14L, 15L, 17L, 20L, 24L, 27L, 29L, 31L, 34L, 38L, 41L, 45L, 
                         48L, 69L, 73L, 77L, 80L, 83L, 1L, 13L, 14L, 15L, 17L, 20L, 24L, 
                         27L, 29L, 31L, 34L, 38L, 41L, 45L, 48L, 69L, 73L, 77L, 80L, 83L, 
                         1L, 13L, 14L, 15L, 17L, 20L, 24L, 27L, 29L, 31L, 34L, 38L, 41L, 
                         45L, 48L, 69L, 73L, 77L, 80L, 83L, 1L, 13L, 14L, 15L, 17L, 20L, 
                         24L, 27L, 29L, 31L, 34L, 38L, 41L, 45L, 48L, 69L, 73L, 77L, 80L, 
                         83L, 1L, 13L, 14L, 15L, 17L, 20L, 24L, 27L, 29L, 31L, 34L, 38L, 
                         41L, 45L, 48L, 69L, 73L, 77L, 80L, 83L, 1L, 13L, 14L, 15L, 17L, 
                         20L, 24L, 27L, 29L, 31L, 34L, 38L, 41L, 45L, 48L, 69L, 73L, 77L, 
                         80L, 83L, 1L, 13L, 14L, 15L, 17L, 20L, 24L, 27L, 29L, 31L, 34L, 
                         38L, 41L, 45L, 48L, 69L, 73L, 77L, 80L, 83L), percent_surv = c(100L, 
                                                                                        97L, 95L, 94L, 91L, 86L, 81L, 71L, 62L, 60L, 48L, 47L, 36L, 36L, 
                                                                                        34L, 21L, 10L, 9L, 5L, 5L, 100L, 100L, 100L, 99L, 97L, 94L, 92L, 
                                                                                        84L, 76L, 76L, 70L, 67L, 63L, 58L, 58L, 47L, 29L, 22L, 12L, 12L, 
                                                                                        100L, 100L, 100L, 100L, 100L, 100L, 100L, 100L, 100L, 100L, 100L, 
                                                                                        100L, 100L, 99L, 99L, 99L, 98L, 98L, 98L, 98L, 100L, 100L, 100L, 
                                                                                        100L, 100L, 100L, 100L, 100L, 100L, 100L, 100L, 100L, 100L, 100L, 
                                                                                        100L, 100L, 99L, 99L, 99L, 99L, 100L, 100L, 100L, 100L, 100L, 
                                                                                        100L, 100L, 100L, 100L, 100L, 100L, 100L, 100L, 100L, 100L, 98L, 
                                                                                        94L, 92L, 62L, 62L, 100L, 100L, 100L, 100L, 100L, 100L, 100L, 
                                                                                        99L, 99L, 99L, 99L, 99L, 99L, 99L, 99L, 98L, 88L, 85L, 84L, 84L, 
                                                                                        100L, 100L, 100L, 100L, 100L, 100L, 100L, 100L, 100L, 100L, 100L, 
                                                                                        100L, 100L, 100L, 100L, 100L, 100L, 100L, 100L, 99L, 100L, 100L, 
                                                                                        100L, 100L, 100L, 100L, 100L, 100L, 100L, 100L, 100L, 100L, 100L, 
                                                                                        100L, 100L, 100L, 100L, 100L, 100L, 100L), treatment = structure(c(1L, 
                                                                                                                                                           1L, 1L, 1L, 1L, 1L, 1L, 1L, 1L, 1L, 1L, 1L, 1L, 1L, 1L, 1L, 1L, 
                                                                                                                                                           1L, 1L, 1L, 2L, 2L, 2L, 2L, 2L, 2L, 2L, 2L, 2L, 2L, 2L, 2L, 2L, 
                                                                                                                                                           2L, 2L, 2L, 2L, 2L, 2L, 2L, 3L, 3L, 3L, 3L, 3L, 3L, 3L, 3L, 3L, 
                                                                                                                                                           3L, 3L, 3L, 3L, 3L, 3L, 3L, 3L, 3L, 3L, 3L, 4L, 4L, 4L, 4L, 4L, 
                                                                                                                                                           4L, 4L, 4L, 4L, 4L, 4L, 4L, 4L, 4L, 4L, 4L, 4L, 4L, 4L, 4L, 5L, 
                                                                                                                                                           5L, 5L, 5L, 5L, 5L, 5L, 5L, 5L, 5L, 5L, 5L, 5L, 5L, 5L, 5L, 5L, 
                                                                                                                                                           5L, 5L, 5L, 6L, 6L, 6L, 6L, 6L, 6L, 6L, 6L, 6L, 6L, 6L, 6L, 6L, 
                                                                                                                                                           6L, 6L, 6L, 6L, 6L, 6L, 6L, 7L, 7L, 7L, 7L, 7L, 7L, 7L, 7L, 7L, 
                                                                                                                                                           7L, 7L, 7L, 7L, 7L, 7L, 7L, 7L, 7L, 7L, 7L, 8L, 8L, 8L, 8L, 8L, 
                                                                                                                                                           8L, 8L, 8L, 8L, 8L, 8L, 8L, 8L, 8L, 8L, 8L, 8L, 8L, 8L, 8L), .Label = c("Broom_drought_live", 
                                                                                                                                                                                                                                   "Broom_drought_sterile", "Broom_wet_live", "Broom_wet_sterile", 
                                                                                                                                                                                                                                   "uninvaded_drought_live", "uninvaded_drought_sterile", "uninvaded_wet_live", 
                                                                                                                                                                                                                                   "uninvaded_wet_sterile"), class = "factor")), class = "data.frame", row.names = c(NA, 
                                                                                                                                                                                                                                                                                                                     -160L))

### end of structure command

cont_surv %>% 
  as_tibble() %>% 
  # identify day of first drop per treatment
  group_by(treatment) %>% 
  arrange(desc(percent_surv)) %>% 
  mutate(lag.ps = lag(percent_surv, default = 100 )) %>% 
  mutate(ps.drop = (percent_surv - lag.ps) < 0) %>% 
  mutate(first.drop = if_else(lag.ps == 100 & ps.drop, Day, 0L)) %>% 
  ungroup() %>% 
  # order treatments by day of first drop
  group_by(first.drop > 0) %>% 
  arrange(desc(first.drop)) %>% 
  mutate(v_nudge = sign(first.drop)*row_number()) %>% 
  ungroup() %>% 
  # make v_nudge consistent for treatment across all days
  group_by(treatment) %>% 
  mutate(v_nudge = max(v_nudge)) %>% 
  ungroup() %>% 
  ggplot( 
    aes(
      x=Day,
      y=percent_surv - v_nudge,
      group = treatment,
      xlab = "Days since drought treatment start",
      ylab = "Percent surviving"
    )
  )+
  geom_line(aes(linetype=treatment,
                color = treatment)
  ) +
  scale_linetype_manual(values= c(5,5,1,1,4,4,3,3)
  )+
  scale_color_manual(values=c(
    "chartreuse3", 
    "brown", 
    "chartreuse3",
    "brown",
    "chartreuse3",
    "brown",
    "chartreuse3",
    "brown"
  ))+
  scale_size_manual(values=c(1,1.5))

Created on 2020-03-11 by the reprex package (v0.3.0)

1 Like

Dromano, thank you! I don't know why I didn't see this until now. It's beautiful.

1 Like

This topic was automatically closed 7 days after the last reply. New replies are no longer allowed.