Hello Anders,
Welcome to RStudio Community. It is most useful if you can provide a reproducible example of your data and code. Please read the below link carefully as to how to produce one:
FAQ: What's a reproducible example (reprex) and how do I create one?
A generic example of something similar is below:
library(tidyverse)
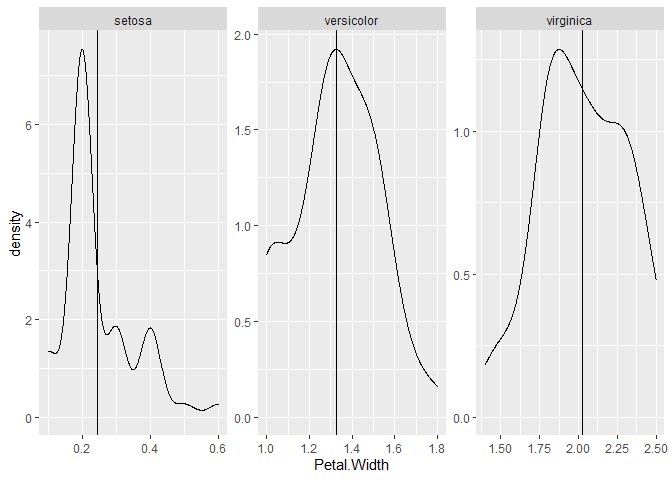
tibble(iris) |>
group_by(Species) |>
mutate(mean = mean(Petal.Width)) |>
ggplot(aes(x = Petal.Width)) +
geom_density() +
geom_vline(aes(xintercept = mean)) +
facet_wrap(~Species, scales = "free")
Created on 2022-01-25 by the reprex package (v2.0.1)