atusy
May 2, 2019, 3:37am
1
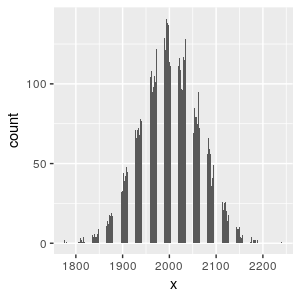
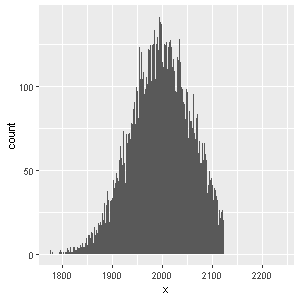
I find histograms by graphics or ggplot2 lacks some columns ought to be shown.
Is this a bug of graphic device?
I found the problem is reproducible when
Bins with 0 counts exist between bins with non-zero counts.
Size of graphic device is not large enough
set.seed(1)
x <- rpois(1e4, 1000) * 2
ggplot2::geom_histogramlibrary(ggplot2)
ggplot(data.frame(x = x), aes(x)) +
geom_histogram(binwidth = 1)
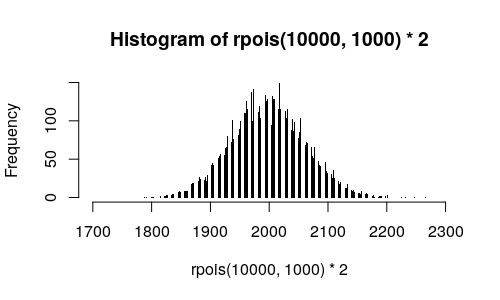
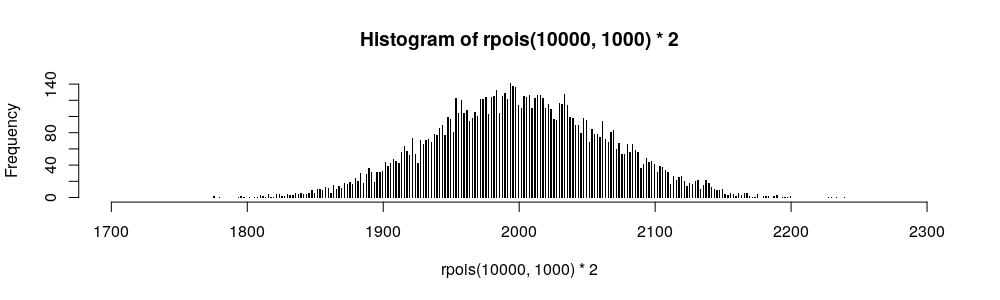
graphics::histhist(x, breaks = 1700:2300, col = "black", border = "transparent")
This should not occur with continuous data. And, as far as I understand, histogram is not appropriate for discrete data .
For these type of data, usually people use Bar Chart (using graphics::barplot or ggplot2::geom_bar).
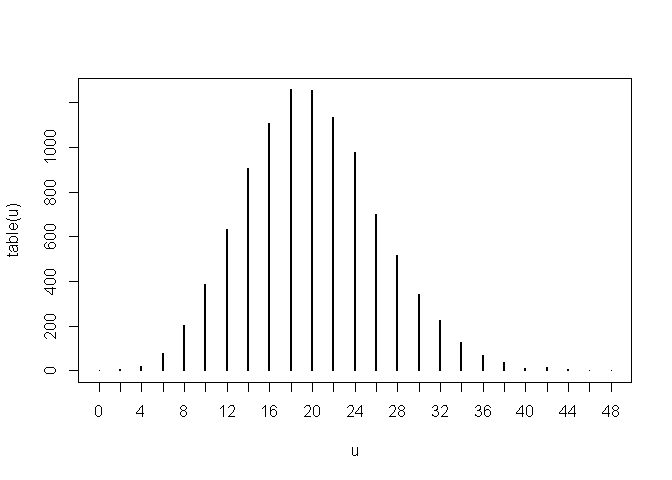
My personal preference is to use a column diagram (I'm not sure whether this is a standard term or not), as widths of the bars make no sense to me.
You can see the illustration below. Here, I've used a smaller value of \lambda , only to make the plots less cluttered.
# for reproducibility
set.seed(seed = 29842)
# dummy data
u <- rpois(n = 1e+4,
lambda = 10) * 2
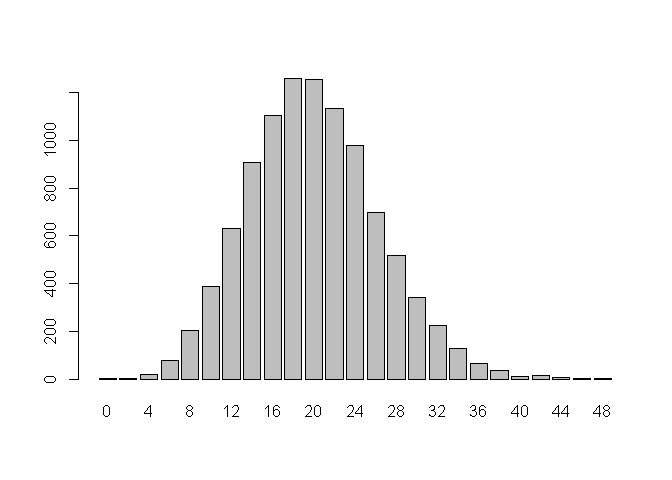
# graphics:;barplot
barplot(height = table(u))
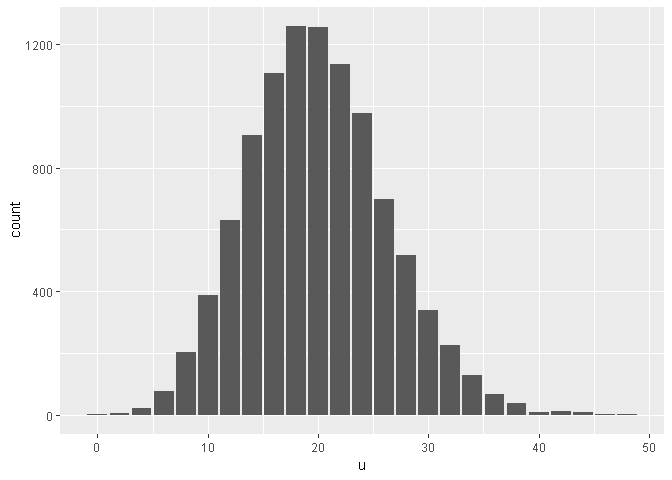
# ggplot2::geom_bar
library(ggplot2)
#> Registered S3 methods overwritten by 'ggplot2':
#> method from
#> [.quosures rlang
#> c.quosures rlang
#> print.quosures rlang
ggplot2::ggplot(data = data.frame(x = u),
mapping = aes(x = u)) +
geom_bar()
# my personal preference
plot(x = table(u),
type = "h")
Created on 2019-05-02 by the reprex package (v0.2.1)
atusy
May 2, 2019, 4:31am
3
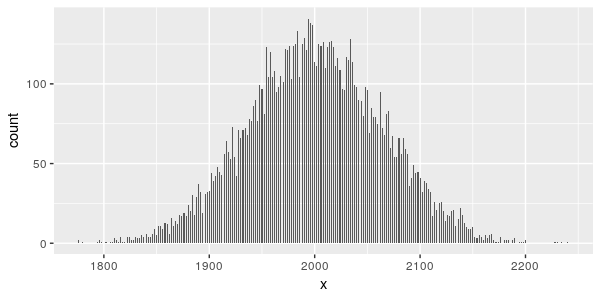
You are right that bar plot is more appropriate for discrete data, however, the problem may occur even if using bar plot.
In case of ggplot2, this is because both geom_histogram and geom_bar are using GeomBar to draw bins/bars.
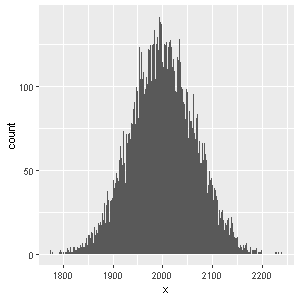
set.seed(1)
x <- rpois(1e4, 1000) * 2
library(ggplot2)
ggplot(data.frame(x = x), aes(x)) +
  geom_histogram(binwidth = 1)
I'm not comfortable with ggplot2, and hence I'm not confident with what I'm going to say below.
I think if you use a binwidth argument in geom_bar, then it actually uses geom_histogram. I'm guessing it because of this:
binwidth geom_bar() no longer has a binwidth argument - if you use it you'll get an warning telling to you use geom_histogram() instead.
I hope others with more expertise in ggplot2 will chime in and confirm/discard this claim.
If I use geom_bar() instead, and even if I use 300x300, I do not see this problem.
set.seed(1)

x <- rpois(1e4, 1000) * 2

library(ggplot2)

png(filename = "bar_300_300.png",
    width = 300,
    height = 300)
ggplot(data.frame(x = x), aes(x)) +
  geom_bar()
dev.off()
Edit
Actually, I don't face your problem even with your code. See below:
set.seed(1)
x <- rpois(1e4, 1000) * 2
library(ggplot2)
png("histogram_300_300.png",300,300)
ggplot(data.frame(x = x), aes(x)) +
  geom_histogram(binwidth = 1)
dev.off()
atusy
May 2, 2019, 5:02am
5
Thank you for your information.
So the problem seems to be system dependent.
I made the plots on the original post by resizing plots on RStudio.
Viewer -> Export -> Copy to Clipboard...
I attatch the sessionInfo() at the end of this reply.
May I ask yours too?
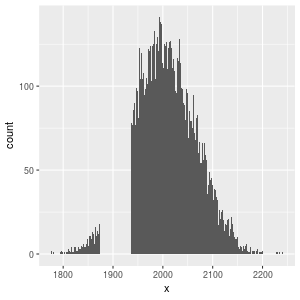
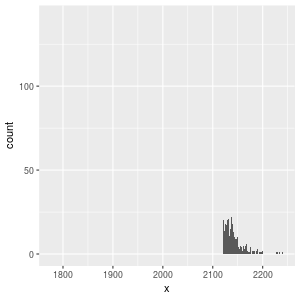
BTW, your codes on my environment gives much more strange results...
sessionInfo()The following environment is created by a docker image, atusy/atusyverse, which is primarily based on rocker/verse.
R version 3.5.3 (2019-03-11)
Platform: x86_64-pc-linux-gnu (64-bit)
Running under: Debian GNU/Linux 9 (stretch)

Matrix products: default
BLAS: /usr/lib/openblas-base/libblas.so.3
LAPACK: /usr/lib/libopenblasp-r0.2.19.so

locale:
 [1] LC_CTYPE=en_US.UTF-8       LC_NUMERIC=C
 [3] LC_TIME=en_US.UTF-8        LC_COLLATE=en_US.UTF-8
 [5] LC_MONETARY=en_US.UTF-8    LC_MESSAGES=C
 [7] LC_PAPER=en_US.UTF-8       LC_NAME=C
 [9] LC_ADDRESS=C               LC_TELEPHONE=C
[11] LC_MEASUREMENT=en_US.UTF-8 LC_IDENTIFICATION=C

attached base packages:
[1] stats     graphics  grDevices utils     datasets  methods   base

other attached packages:
[1] ggplot2_3.1.1

loaded via a namespace (and not attached):
 [1] Rcpp_1.0.1       withr_2.1.2      assertthat_0.2.1 crayon_1.3.4
 [5] dplyr_0.8.0.1    grid_3.5.3       plyr_1.8.4       R6_2.4.0
 [9] gtable_0.3.0     magrittr_1.5     scales_1.0.0     pillar_1.3.1
[13] rlang_0.3.4      lazyeval_0.2.2   rstudioapi_0.10  glue_1.3.1
[17] purrr_0.3.2      munsell_0.5.0    compiler_3.5.3   pkgconfig_2.0.2
[21] colorspace_1.4-1 tidyselect_0.2.5 tibble_2.1.1
atusy:
May I ask yours too?
Sure, here it is:
> sessionInfo()
R version 3.6.0 (2019-04-26)
Platform: x86_64-w64-mingw32/x64 (64-bit)
Running under: Windows 10 x64 (build 17763)

Matrix products: default

locale:
[1] LC_COLLATE=English_India.1252  LC_CTYPE=English_India.1252
[3] LC_MONETARY=English_India.1252 LC_NUMERIC=C
[5] LC_TIME=English_India.1252

attached base packages:
[1] stats     graphics  grDevices utils     datasets  methods   base

other attached packages:
[1] ggplot2_3.1.1

loaded via a namespace (and not attached):
 [1] Rcpp_1.0.1       withr_2.1.2      crayon_1.3.4     dplyr_0.8.0.1
 [5] assertthat_0.2.1 grid_3.6.0       plyr_1.8.4       R6_2.4.0
 [9] gtable_0.3.0     magrittr_1.5     scales_1.0.0     pillar_1.3.1
[13] rlang_0.3.4      lazyeval_0.2.2   glue_1.3.1       purrr_0.3.2
[17] munsell_0.5.0    compiler_3.6.0   pkgconfig_2.0.2  colorspace_1.4-1
[21] tidyselect_0.2.5 tibble_2.1.1
The plots you've shown are really strange. I can only suggest you to try again in R itself, instead of RStudio to check whether you get the same or not.
But this is beyond my understanding and I can't help with this problem. Sorry, and good luck!
Just a small side note here that I think is relevant for people testing this examples.
As of R 3.6, the random number generator will use a different default algorithm. As a result, functions like sample() will give different results with the same seed.
atusy
May 2, 2019, 6:13am
8
Thank you @Yarnabrina anyway for helping me.
I tried the codes in your post #4 on R 3.6.0 on Manjaro Linux and still gets the same resulsts as my post #5 ...
Hope someone will help.
@andresrcs : I guess R version does not affect examples here because a change in sample() is related to a discrete uniform distribution, not Poisson distribution. https://cran.r-project.org/doc/manuals/r-devel/NEWS.html
system
May 23, 2019, 6:13am
9
This topic was automatically closed 21 days after the last reply. New replies are no longer allowed.