I have data that includes a lot of zeros and so would like to make a histogram that has "0" as its own bin. My attempts to do this return errors in R such as:
head(env_subset$den)
[1] 0.010339885 0.004557282 0.003436797 0.000000000 0.000000000 0.000000000
env_subset$bins <- cut(env_subset$den, breaks=c(0, 0, 0.001, 0.005, 0.01, 0.05, 0.1, 0.4),
labels=c("0-0.001","0.001-0.005","0.005-0.01","0.01-0.05","0.05-0.1", "0.1+"))
Error in cut.default(env_subset$den, breaks = c(0, 0, 0.001, 0.005, 0.01, :
'breaks' are not unique
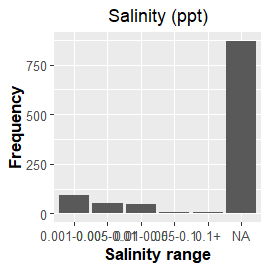
If I try again without giving "0" its own bin I get a plot where all zeros are simply labeled as NA
env_subset$bins <- cut(env_subset$den, breaks=c(0, 0.001, 0.005, 0.01, 0.05, 0.1, 0.4),
labels=c("0-0.001","0.001-0.005","0.005-0.01","0.01-0.05","0.05-0.1", "0.1+"))
ggplot(env_subset, aes(bins)) +
geom_bar() +
labs(title="Salinity (ppt)",x="Salinity range", y = "Frequency") +
theme(plot.title = element_text(hjust = 0.5)) +
theme(axis.text = element_text(size = 10)) +
theme(axis.title = element_text(size = 13, face = "bold"))

