Problem
I need to add a higher level of interactivity on my leaflet map in R, so that when users hover on a destination point, all of the related routes then get highlighted.
I'm using leaflet for the map, geosphere for the curved lines, sp to build a lines df. This is being integrated into a markdown/flexdashboard product. Preferred answers are ones with working code which can be implemented in R itself if at all possible (and I don't mind a bit of CSS if required).
Dummy Example with Fully Replicable Code
rm(list=ls())
library(tidyverse)
library(sp)
library(geosphere)
library(leaflet)

data <- data.frame(source_airport=c("DC","SEA","LA"),dest_airport=c("LA","LA","JFK"),
                   source_airport_longitude=c(-77.068, -122.181, -118.17),
                   source_airport_latitude=c(38.885, 47.863, 34.18),
                   dest_airport_longitude=c(-118.17, -118.17, -73.49),
                   dest_airport_latitude=c(34.18, 34.18, 40.38),
                   id=c(1,2,4),stringsAsFactors = F)


listlines <- list()
for (i in 1:nrow(data)) {
  connection <- gcIntermediate(c(data[i,]$source_airport_longitude, data[i,]$source_airport_latitude),
                               c(data[i,]$dest_airport_longitude, data[i,]$dest_airport_latitude),
                               n = 50,
                               addStartEnd = TRUE,
                               sp = TRUE)

  listlines[[i]] <- Lines(connection@lines[[1]]@Lines, ID = i)
}

sldf <- SpatialLinesDataFrame(SpatialLines(listlines), data.frame(count = data$id))

leaflet() %>%
  addTiles() %>%
  addProviderTiles(providers$CartoDB.DarkMatter) %>%
  # lines
  addPolylines(data=sldf,
               weight = 2,
               color = "#C0DCDC",
               label = ~paste0(data$source_airport, " to ", data$dest_airport),
               highlightOptions = highlightOptions(color = "white",
                                                   weight = 4)) %>%
  # destination circle markers
  addCircleMarkers(data = data, lng = ~dest_airport_longitude, lat = ~dest_airport_latitude,
                   color = "#B7767E",
                   opacity = 8,
                   radius = 9,
                   stroke = FALSE,
                   fillOpacity = 0.8,
                   label = ~paste0(dest_airport))
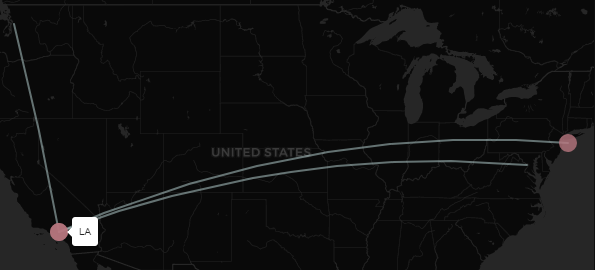
You can see destinations in red here, and routes in cyan-blue. If I'm hovering over the LA destination, I want all routes to LA to get highlighted.

Bonus points(!)
Not essential for an answer, but may be cool:
- Is it possible to dull all other irrelevant polylines when you're hovering over a destination?
- I'm not fiddling with JS (and only minimally with the CSS), but still trying to figure out how to highlight the circlemarker itself too. I think highlightoptions doesn't yet exist for circlemarkers?
- A subsequent step would be to try and make it so that hovering over a destination would also force a filter on a related table or plotly chart, as elucidated at the unanswered question at this link here.