Highlight lines in ggplot

Hello,

I am plotting the exports of some countries by year. But I would like to highlight the lines only when ideology (another variable that is not initially plotted) is greater than 1.

This is my reproducible df

mydata<-data.frame(
  stringsAsFactors = FALSE,
           country = c("Argentina","Argentina",
                       "Argentina","Brazil","Brazil","Brazil","Brazil","Brazil",
                       "Brazil","Brazil","Brazil","Paraguay","Paraguay",
                       "Paraguay","Paraguay"),
              year = c(2013,2014,2015,2013,2014,
                       2015,2016,2017,2018,2019,2020,2013,2014,2015,2016),
           exports = c(38.2855406225,35.9858787505,
                       31.9058862432,17.6972935715,16.5960331603,16.6304797725,
                       16.7424157047,16.409514612,15.1758205796,
                       12.6512430879,10.8435833607,49.0083433775,49.9878335127,
                       51.2451776775,56.3230709414),
          ideology = c(-1.663,-1.663,-1.659,-1.296,
                       -1.46,-1.46,-1.46,0.668,0.792,3.251,3.251,1.935,
                       1.655,1.655,1.655)

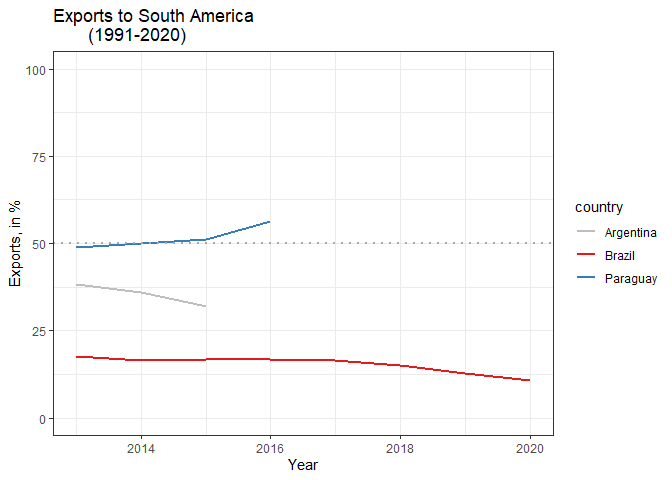
And this is the code I have used to get the following line graph

ggplot(mydata, aes(year, exports, fill=country, color=country)) +
  geom_line(size=1) +
  ylim(0, 100)+
  geom_hline(aes(yintercept=50), lty = "dotted", colour= "dark grey",size=1) +
  labs(x = "Year",
       y = "Exports, in %",
       title = "Exports to South America
       (1991-2020)") +
  theme_bw()

For instance, the line corresponding to Paraguay should have a colour, because of the ideology measurement, while Argentina should be in grey.
I have tried to use gghighlight(), but was unsuccesful.

I appreciate your help

Hi there,

You can use the scale_color_manual function to update colors of specific elements. I've written some extra code to calculate in which cases we like color and which ones gray.

library(tidyverse)

mydata<-data.frame(
  stringsAsFactors = FALSE,
  country = c("Argentina","Argentina",
              "Argentina","Brazil","Brazil","Brazil","Brazil","Brazil",
              "Brazil","Brazil","Brazil","Paraguay","Paraguay",
              "Paraguay","Paraguay"),
  year = c(2013,2014,2015,2013,2014,
           2015,2016,2017,2018,2019,2020,2013,2014,2015,2016),
  exports = c(38.2855406225,35.9858787505,
              31.9058862432,17.6972935715,16.5960331603,16.6304797725,
              16.7424157047,16.409514612,15.1758205796,
              12.6512430879,10.8435833607,49.0083433775,49.9878335127,
              51.2451776775,56.3230709414),
  ideology = c(-1.663,-1.663,-1.659,-1.296,
               -1.46,-1.46,-1.46,0.668,0.792,3.251,3.251,1.935,
               1.655,1.655,1.655))

#Check which lines should have color
lineColor = mydata %>% group_by(country) %>% 
  summarise(color = ifelse(any(ideology > 1), "color", "gray"))
lineColor
#> # A tibble: 3 x 2
#>   country   color
#>   <chr>     <chr>
#> 1 Argentina gray 
#> 2 Brazil    color
#> 3 Paraguay  color

#Which lines need color
hasColor = which(lineColor$color == "color")
#Set a list of colors (you can set whatever you like)
myColors = RColorBrewer::brewer.pal(n = 8, name = 'Set1')

#If any lines have color other than gray, give them color
if(length(hasColor) > 0){
  lineColor$color[hasColor] = myColors[1:length(hasColor)]
}
lineColor
#> # A tibble: 3 x 2
#>   country   color  
#>   <chr>     <chr>  
#> 1 Argentina gray   
#> 2 Brazil    #E41A1C
#> 3 Paraguay  #377EB8

#Plot
ggplot(mydata, aes(year, exports, fill=country, color=country)) +
  geom_line(size=1) +
  #Fill the lines with color set by the lineColor data frame
  scale_color_manual(values = setNames(lineColor$color, lineColor$country)) +
  ylim(0, 100)+
  geom_hline(aes(yintercept=50), lty = "dotted", colour= "dark grey",size=1) +
  labs(x = "Year",
       y = "Exports, in %",
       title = "Exports to South America
       (1991-2020)") +
  theme_bw()

Created on 2022-04-24 by the reprex package (v2.0.1)

Hope this helps,
PJ

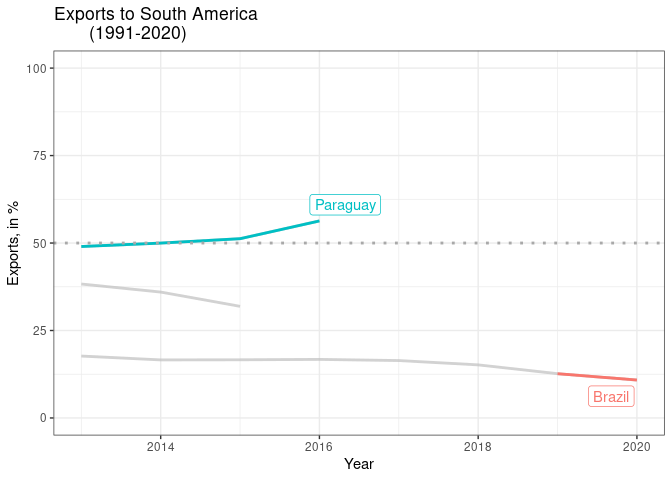
A couple of options using gghighlight

library(tidyverse)
library(gghighlight)

mydata <- data.frame(
  stringsAsFactors = FALSE,
           country = c("Argentina","Argentina",
                       "Argentina","Brazil","Brazil","Brazil","Brazil","Brazil",
                       "Brazil","Brazil","Brazil","Paraguay","Paraguay",
                       "Paraguay","Paraguay"),
              year = c(2013,2014,2015,2013,2014,
                       2015,2016,2017,2018,2019,2020,2013,2014,2015,2016),
           exports = c(38.2855406225,35.9858787505,
                       31.9058862432,17.6972935715,16.5960331603,16.6304797725,
                       16.7424157047,16.409514612,15.1758205796,
                       12.6512430879,10.8435833607,49.0083433775,49.9878335127,
                       51.2451776775,56.3230709414),
          ideology = c(-1.663,-1.663,-1.659,-1.296,
                       -1.46,-1.46,-1.46,0.668,0.792,3.251,3.251,1.935,
                       1.655,1.655,1.655)
)


ggplot(mydata, aes(year, exports, color = country)) +
    geom_line(size=1) +
    gghighlight(ideology > 1) +
    ylim(0, 100)+
    geom_hline(aes(yintercept=50), lty = "dotted", colour= "dark grey",size=1) +
    labs(x = "Year",
         y = "Exports, in %",
         title = "Exports to South America
       (1991-2020)") +
    theme_bw()

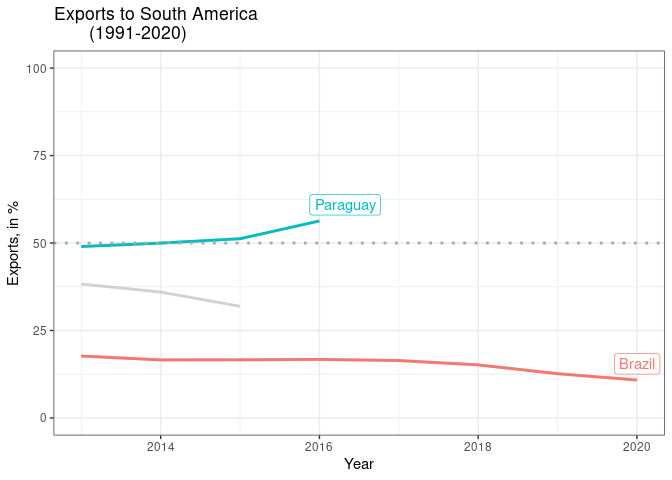
mydata %>% 
    group_by(country) %>% 
    mutate(highlight = if_else(any(ideology > 1), T, F)) %>% 
    ggplot(aes(year, exports, color = country)) +
    geom_line(size=1) +
    gghighlight(highlight) +
    ylim(0, 100)+
    geom_hline(aes(yintercept=50), lty = "dotted", colour= "dark grey",size=1) +
    labs(x = "Year",
         y = "Exports, in %",
         title = "Exports to South America
       (1991-2020)") +
    theme_bw()

Created on 2022-04-24 by the reprex package (v2.0.1)

1 Like

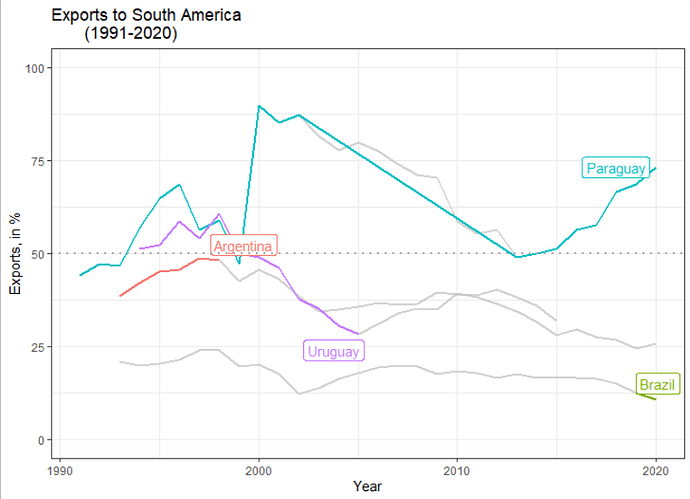
This first option is exactly what I'm looking for. However, when I run for the entire dataset, I have a problem. Looking at Paraguay, the blue line connects two points (which have ideology > 1). We can actually see the "real" grey line behind it, when ideology is smaller than 1.
As the governments change over the years, the same goes for ideology. So, in certain periods I need the grey line, while for others I need the filled lines.

Its recommended that you provide example data which is close enough to your actual data to reproduce the challenge under discussion. This is likely to increase the odds of a forum user providing you a solution

1 Like

I have expanded it to include the issue I mentioned:

data.frame(
  stringsAsFactors = FALSE,
           country = c("Argentina","Argentina",
                       "Argentina","Argentina","Argentina","Argentina",
                       "Argentina","Argentina","Argentina","Argentina","Argentina",
                       "Argentina","Argentina","Argentina","Argentina",
                       "Argentina","Argentina","Argentina","Argentina","Argentina",
                       "Argentina","Argentina","Argentina","Brazil",
                       "Brazil","Brazil","Brazil","Brazil","Brazil","Brazil",
                       "Brazil","Brazil","Brazil","Brazil","Brazil","Brazil",
                       "Brazil","Brazil","Brazil","Brazil","Brazil","Brazil",
                       "Brazil","Brazil","Brazil","Brazil","Brazil",
                       "Brazil","Brazil","Brazil","Brazil","Paraguay","Paraguay",
                       "Paraguay","Paraguay","Paraguay","Paraguay",
                       "Paraguay","Paraguay","Paraguay","Paraguay","Paraguay",
                       "Paraguay","Paraguay","Paraguay","Paraguay","Paraguay",
                       "Paraguay","Paraguay","Paraguay","Paraguay","Paraguay",
                       "Paraguay","Paraguay","Paraguay","Paraguay",
                       "Paraguay","Paraguay","Paraguay","Paraguay","Paraguay",
                       "Uruguay","Uruguay","Uruguay","Uruguay","Uruguay",
                       "Uruguay","Uruguay","Uruguay","Uruguay","Uruguay",
                       "Uruguay","Uruguay","Uruguay","Uruguay","Uruguay","Uruguay",
                       "Uruguay","Uruguay","Uruguay","Uruguay","Uruguay",
                       "Uruguay","Uruguay","Uruguay","Uruguay","Uruguay",
                       "Uruguay"),
              year = c(1993,1994,1995,1996,1997,
                       1998,1999,2000,2001,2002,2003,2004,2005,2006,2007,
                       2008,2009,2010,2011,2012,2013,2014,2015,1993,
                       1994,1995,1996,1997,1998,1999,2000,2001,2002,2003,
                       2004,2005,2006,2007,2008,2009,2010,2011,2012,
                       2013,2014,2015,2016,2017,2018,2019,2020,1991,1992,
                       1993,1994,1995,1996,1997,1998,1999,2000,2001,
                       2002,2003,2004,2005,2006,2007,2008,2009,2010,2011,
                       2012,2013,2014,2015,2016,2017,2018,2019,2020,
                       1994,1995,1996,1997,1998,1999,2000,2001,2002,2003,
                       2004,2005,2006,2007,2008,2009,2010,2011,2012,
                       2013,2014,2015,2016,2017,2018,2019,2020),
           exports = c(38.6333740767,42.1954547366,
                       45.2345785542,45.569595128,48.7188632608,48.1126398001,
                       42.4971450527,45.7873175404,43.1561350265,
                       38.5730276154,34.5299232112,34.9858270088,35.6924721818,
                       36.8361301685,36.1622684687,36.413588079,39.4712741451,
                       39.0192905155,38.7606707095,40.3247797059,38.2855406225,
                       35.9858787505,31.9058862432,21.0892010133,20.0028667569,
                       20.4405039263,21.512891835,24.1403324779,24.139188442,
                       19.6559507944,20.1779683149,17.6569742824,
                       12.391780713,13.9200434874,16.4469281031,17.9832801386,
                       19.4266986451,19.9450230978,19.5754187316,17.774931028,
                       18.5286310711,17.8326458424,16.7031252754,17.6972935715,
                       16.5960331603,16.6304797725,16.7424157047,16.409514612,
                       15.1758205796,12.6512430879,10.8435833607,44.1700372545,
                       47.3314109902,46.8031459989,56.889350948,
                       64.7627089164,68.5609919718,56.3741248081,58.8238619109,
                       47.1924225239,89.8125635575,85.2383382107,87.1476559596,
                       81.6127962474,77.7057956151,79.8007485813,77.5823150231,
                       73.9306351971,71.1161858357,70.3889143263,58.714886315,
                       55.3580029016,56.2661231459,49.0083433775,49.9878335127,
                       51.2451776775,56.3230709414,57.5761518694,
                       66.4867117507,68.6989657048,73.11522,51.2198948586,
                       52.2412129391,58.7534556199,54.1373956387,60.8066508638,
                       50.1119269428,48.9961067276,46.1442276128,37.6649150131,
                       35.2689922964,30.7523589203,28.2610650171,31.095132088,
                       34.0575226357,35.3217003726,35.0092145647,39.3213984614,
                       38.3100817056,36.4908969264,34.5196906413,31.7048489732,
                       28.0738845338,29.6669340099,27.6770927603,
                       26.8658806638,24.4126563769,25.704019649),
          ideology = c(1.304,1.304,1.176,1.176,
                       1.172,1.172,0.838,0.257,0.262,0.544,-0.416,-0.416,
                       -1.541,-1.541,-1.659,-1.659,-1.664,-1.664,-1.686,
                       -1.686,-1.663,-1.663,-1.659,0.02,0.091,0.091,0.386,
                       0.386,0.932,0.932,0.932,0.932,0.871,-1.455,-1.455,
                       -1.455,-1.455,-1.455,-1.455,-1.455,-1.296,-1.296,
                       -1.296,-1.296,-1.46,-1.46,-1.46,0.668,0.792,3.251,
                       3.251,1.532,1.532,1.647,1.647,1.647,1.647,1.647,
                       1.648,1.648,1.648,1.648,1.648,0.551,0.551,0.551,
                       0.551,0.551,0.551,-0.175,-0.175,-0.175,-0.175,1.935,
                       1.655,1.655,1.655,1.655,1.655,1.655,1.655,1.395,
                       1.395,1.006,1.006,1.006,1.078,1.078,1.078,1.078,
                       1.078,1.088,1.088,-1.341,-1.341,-1.341,-1.334,
                       -1.334,-1.334,-1.334,-1.334,-1.334,-1.334,-1.334,-1.334,
                       -1.334,-1.077,-1.077)
)
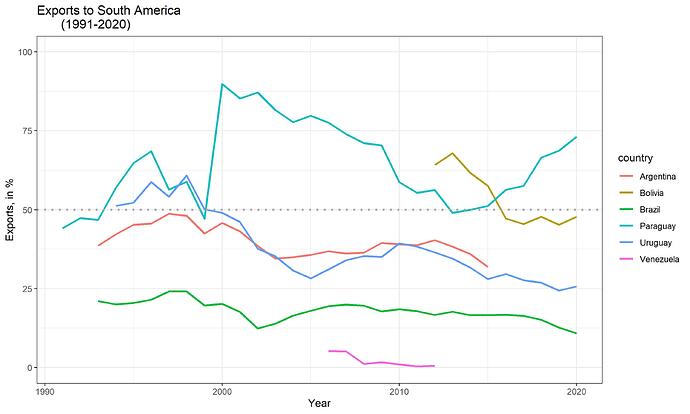
I gave it my best shot, I found it challenging, possible mistakes...


(mydata2 <- mydata %>% mutate(
  v1 = ifelse(ideology>1,TRUE,FALSE)
) %>% group_by(country) %>% 
  mutate(v2=v1!=lag(v1,default = TRUE),
         v3=cumsum(v2)) %>% ungroup()) 

#line connecting 
min_years <- group_by(mydata2,country) %>% summarise(min_year = min(year))
(candidate_fillers <- mydata2 %>% filter(v2==TRUE) %>% mutate(v3=v3-1,v1=!v1) %>%
    left_join(min_years))
(fillers <- filter(candidate_fillers,
                   year != min_year))
mydata3 <- bind_rows(mydata2,
                     fillers) %>% arrange(country,year,v3) 

mydata4 <- mydata3 %>% rowwise() %>%
                          mutate(display_name1 = 
                                   paste0(country,paste0(rep(" ",v3),collapse=""))) %>% ungroup() %>% mutate(rn=row_number()) %>% 
  group_by(display_name1) %>%   mutate(mm = min(rn)) %>% ungroup() %>% mutate(dmm = dense_rank(mm)) %>% rowwise() %>% 
  mutate(display_name = ifelse(v1,display_name1,paste0(rep(" ",dmm),collapse=""))) %>% ungroup()


ggplot(mydata4, aes(year, exports, color = display_name)) +
  geom_line(size=1) +
  gghighlight(v1,use_direct_label = TRUE,
              label_params = list(nudge_x=-4)) +
  ylim(0, 100)+
  geom_hline(aes(yintercept=50), lty = "dotted", colour= "dark grey",size=1) +
  labs(x = "Year",
       y = "Exports, in %",
       title = "Exports to South America
       (1991-2020)") +
  theme_bw()
2 Likes

Thank you so much! I was not familiar with some of these functions and I learnt a lot from this code

This topic was automatically closed 7 days after the last reply. New replies are no longer allowed.

If you have a query related to it or one of the replies, start a new topic and refer back with a link.