Hi,
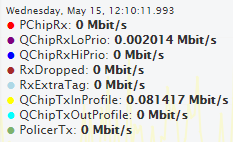
I need to create a chart with a tooltip that is a combination of "shared" and default look.
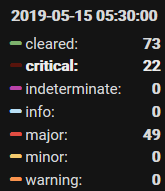
And here is how similar view looks in Grafana:
"Critical" is a series I am currently hovering over and it is bolded in the tooltip.
hc_tooltip(formatter = JS(own_js_code_here), shared = TRUE/FALSE)
Any help appreciated.
paul
May 17, 2019, 1:34pm
2
Yes possible with a custom formatter with shared tooltip set to false!
library(highcharter)

my_tooltip <- "function() {
            var series = this.series.chart.series,
                point = this.point,
                s = '<span style=\"font-size: 10px\">' + this.key + '</span><br/>',
                tmp;

            $.each(series, function(i, serie){
                dot = '<span style=\"color:' + serie.color + '\">\u25CF</span> '
                tmp = serie.data[point.x].series.name + ': ' + point.y + 'm';

                if( serie.index === point.series.index )
                    tmp = '<b>' + tmp + '</b>';

                s += '<br/>' + dot + ' ' + tmp;
            });

            return s;
        }"

highcharts_demo() %>%
  hc_tooltip(formatter = JS(my_tooltip), shared = FALSE)
Thank You for your anwer.
tmp = serie.data[point.x].series.name + ': ' + point.y + 'm';
Cannot read property 'series' of undefined
I think it should be:
tmp = serie.data[i].series.name + ': ' + point.y + 'm';
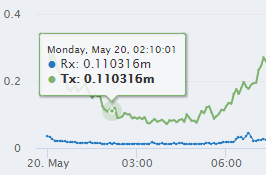
Now the series names are correct, they get bolded as expected, but both values are the same which is not correct:
I will be grateful for solving this problem.
system
June 11, 2019, 2:14pm
4
This topic was automatically closed 21 days after the last reply. New replies are no longer allowed.


