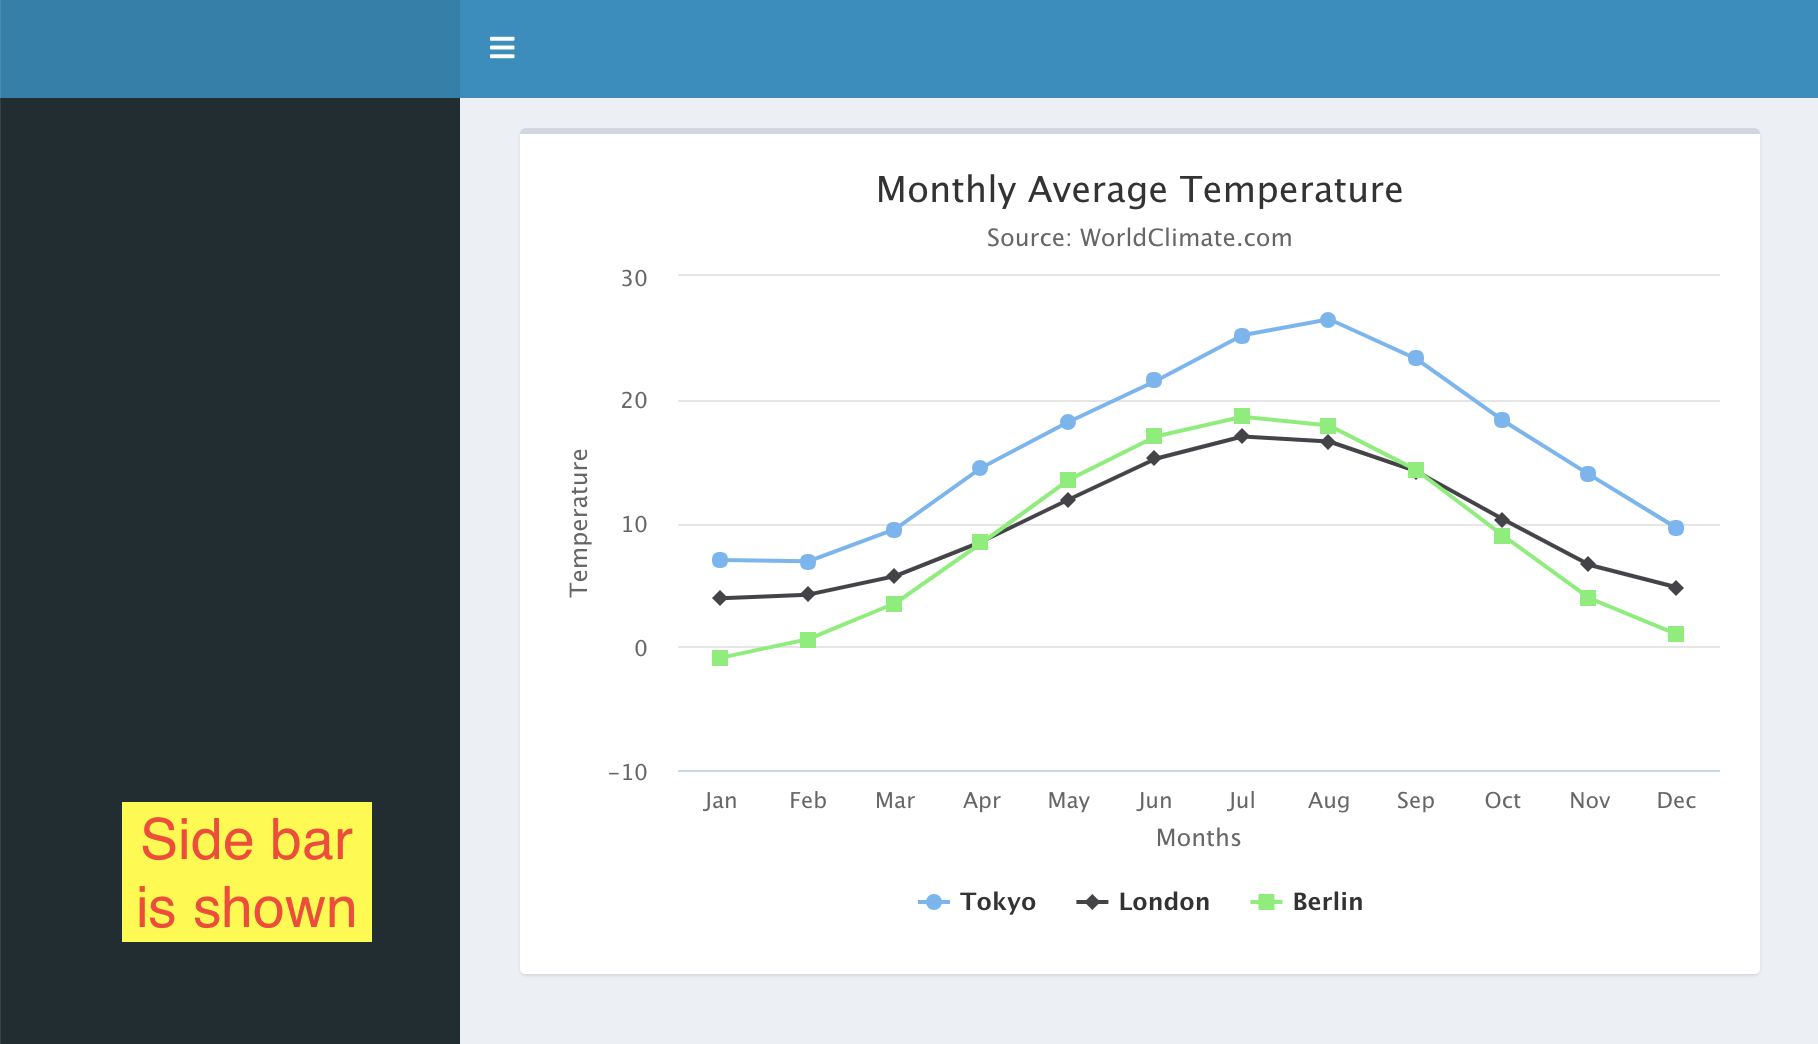
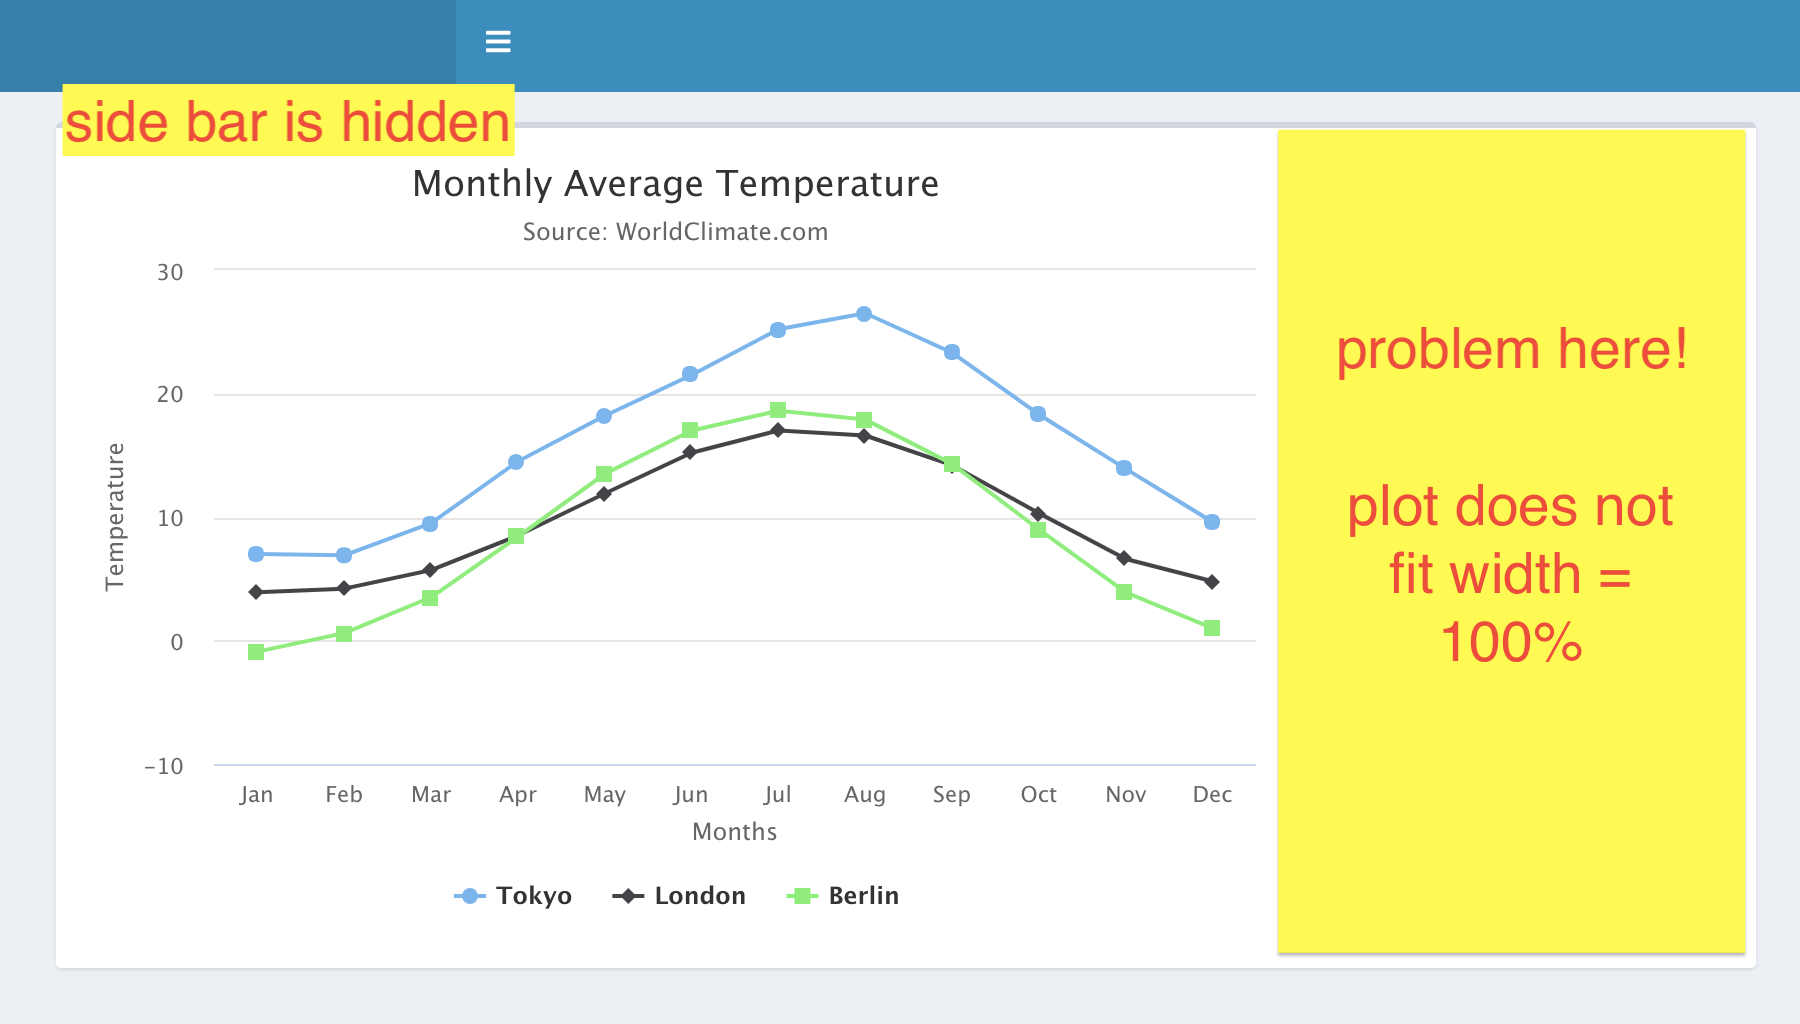
The development-version of highcharter package has the following issue:
highchartOutput DOES NOT automatically resize the width of the plot when hiding the sidebar in shinydashboard. The width of the plot always remains same.
I provide an example here,
# install development-version of highcharter
# devtools::install_github("jbkunst/highcharter")

library(shinydashboard)
library(shiny)
library(highcharter)
library(dplyr)

ui <- dashboardPage(
  dashboardHeader(),
  dashboardSidebar(),
  dashboardBody(
    box(
      width = 12,
      highchartOutput("plot")
    )
  )
)

server <- function(input, output) {

  output$plot <- renderHighchart({
    highcharts_demo()
  })
}

shinyApp(ui, server)
I have tried
$(document).on("click", ".sidebar-toggle", function() { $(window).trigger("resize"); });
BUT it still does not work for development-version highcharter when I use renderHighchart & highchartOutput functions.
However, I found
-
renderHighchart2andhighchartOutput2working well for resizing. -
BUT
renderHighchart2andhighchartOutput2DO NOT support heatmap, I still need to userenderHighchartandhighchartOutputto get correlation plot.
ANY suggestions for this resizing problem?

