At the base of the dendrogram, each observation forms an individual termination known as the leaf of the tree. As one ascends the structure, pairs of leaves merge to form the first branches. These unions (nodes) correspond to the most similar pairs of observations.
It also happens that branches merge with other branches or with leaves. The earlier (closer to the base of the dendrogram) a merger occurs, the greater the similarity (like 21 - 22).
This means that, for any pair of observations, the point in the tree where the branches containing those observations merge can be identified. The height at which this occurs (vertical axis) indicates how similar/different the two observations are.
The data in point 30 is different of all data and h_clust form a different group. Check the distance between themselves.
- Dendrograms, therefore, should be interpreted solely based on the vertical axis and not by the positions occupied by the observations on the horizontal axis.
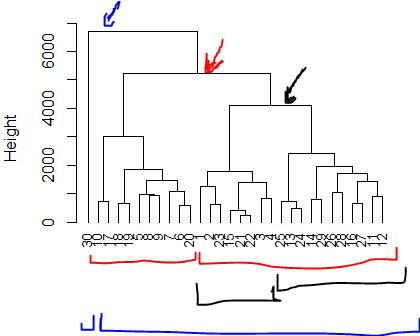
- With level of
6500Height you have 2 groups,30alone a other all observations in group. (arrow blue) - With level of
5000Height, you have 2 groups. But the30group is left out. (arrow red)
fit.average<-hclust(d,method="average")
# Exist other many methods, like `ward`, but depend of data.