omario
September 17, 2022, 4:08pm
1
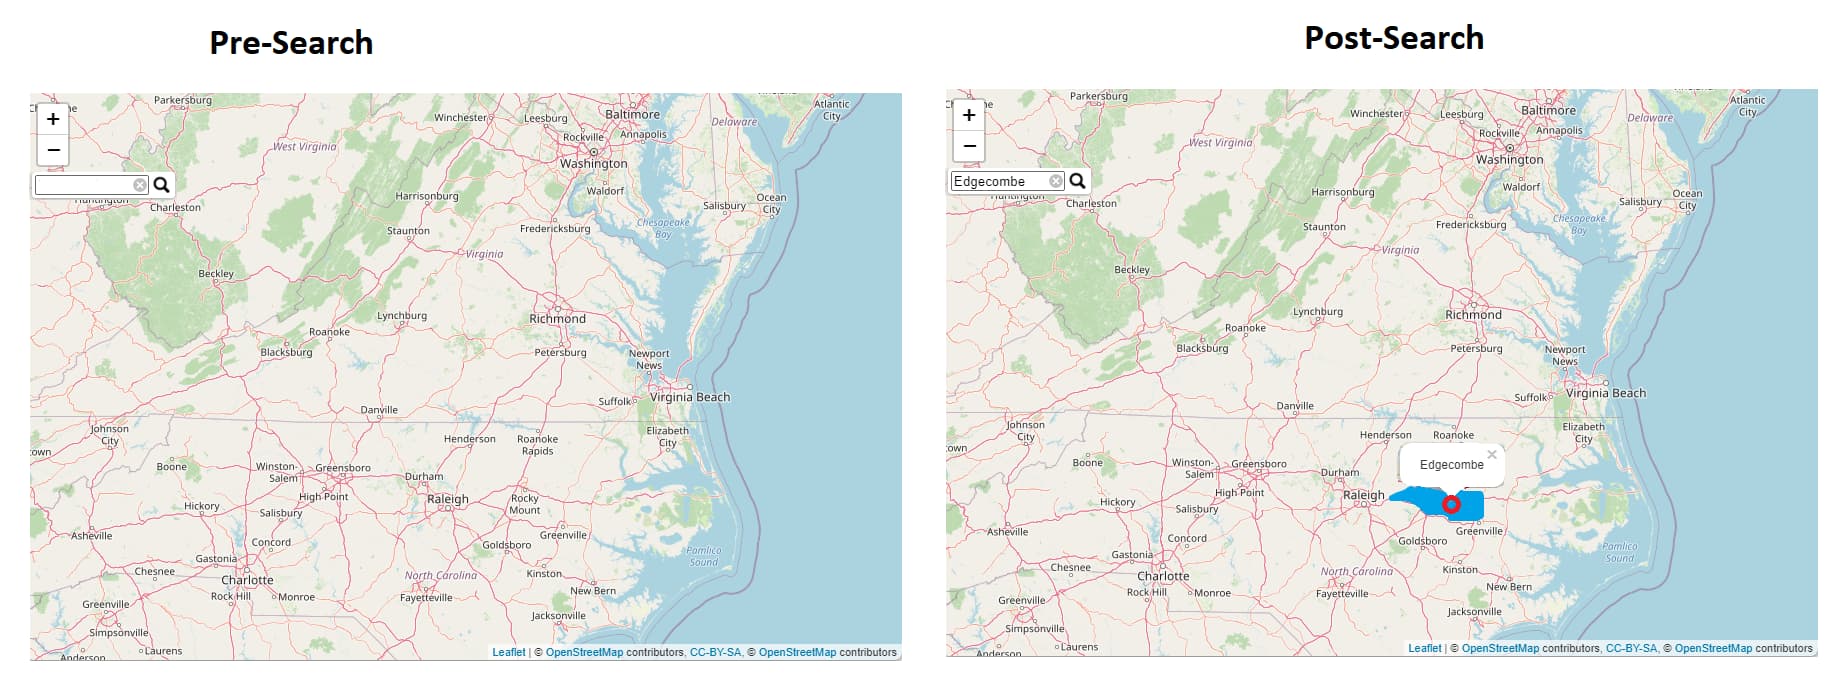
Using the following link as a guide (Possibility of using leaflet.extra::addSearchFeature to addGlPolygons · Issue #18 · r-spatial/leafgl · GitHub ), I made this map that I really like in R:
library(sf)
library(leaflet)
library(leafgl)
library(colourvalues)
library(leaflet.extras)


nc <- st_read(system.file("gpkg/nc.gpkg", package="sf"), quiet = TRUE) %>%
  st_transform(st_crs(4326)) %>%
  st_cast('POLYGON')

leaflet(data = nc) %>% addPolygons( stroke = FALSE) %>% addTiles(group = "OSM") %>%  addProviderTiles(provider = providers$OpenStreetMap) %>% addPolygons(data = nc, weight=1, popup = ~NAME,
                label = ~NAME, group = "name", col = 'blue') %>%
    addSearchFeatures(targetGroups  = 'name', options = searchFeaturesOptions(zoom=10, openPopup=TRUE))
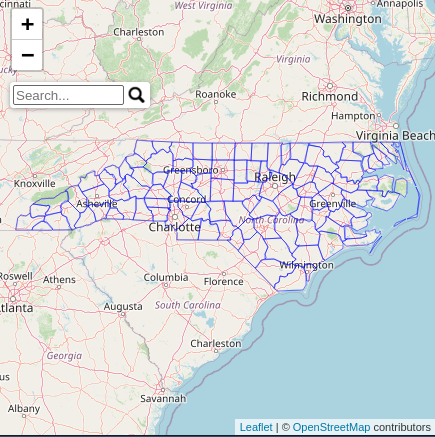
The only thing that I would like to change - I would like to remove the blue color/shading from this map. That is, I would like the user to be able to search for a name on this map (e.g. Edgecombe) - and once the user searchers for this name, ONLY the corresponding region "lights up" in this blue shading.
I tried to do this by manually removing the color option from the leaflet statement:
leaflet(data = nc) %>% addPolygons( stroke = FALSE) %>% addTiles(group = "OSM") %>%  addProviderTiles(provider = providers$OpenStreetMap) %>% addPolygons(data = nc, weight=1, popup = ~NAME,
                label = ~NAME, group = "name" %>%
    addSearchFeatures(targetGroups  = 'name', options = searchFeaturesOptions(zoom=10, openPopup=TRUE))
But nothing has changed.
Does anyone have any ideas on how to this? Something like this?
Thank you!
jlacko
September 17, 2022, 8:54pm
2
Removing the blue color is possible; set it's opacity to zero. Such as in here - setting fillOpacity of the polygons to zero.
Unfortunately I am not aware of a way to flip the color back for the single polygon found; I don't think it is possible, at least without writing custom javascript.
library(sf)
library(leaflet)
library(leafgl)
library(leaflet.extras)


nc <- st_read(system.file("gpkg/nc.gpkg", package="sf"), quiet = TRUE) %>%
  st_transform(st_crs(4326)) %>%
  st_cast("POLYGON")

leaflet(data = nc) %>%
  addProviderTiles(provider = providers$OpenStreetMap) %>%
  addPolygons(data = nc,
              weight=1,
              popup = ~NAME,
              label = ~NAME,
              group = "name",
              col = 'blue',
              fillOpacity = 0) %>%
  addSearchFeatures(targetGroups  = 'name',
                    options = searchFeaturesOptions(zoom=10, openPopup=TRUE))
omario
September 18, 2022, 3:01am
3
Thank you so much for your answer! Can you please explain what you mean by "writing custom Javascript"? Is this possible in R itself? Do you think this would be difficult?
Thank you so much!
jlacko
September 18, 2022, 8:37pm
4
In R you can do a lot, but the interactivity required would need to happen outside of your R session; the leaflet map is a standalone piece of work.
The javascript providing the search feature is distributed as a part of {leaflet.extras} package; the source code is available at leaflet.extras/lfx-search-bindings.js at master · bhaskarvk/leaflet.extras · GitHub .
In theory you should be able to clone it and amend slightly so that the color of a feature found changes.
In practice this would be way over my (very limited) javascript knowledge.
1 Like
omario
September 19, 2022, 4:37pm
5
thank you for your reply I wish there was some tutorial that would show you how to do this!
system
October 31, 2022, 4:37pm
6
This topic was automatically closed 42 days after the last reply. New replies are no longer allowed.