..I just need the << CL = timeCL * actspeedinkmph * 5/18>> the CL to be shown somewhere on the mainpanel, its the last part of server.R. Could you help me make the necessary changes. Thank You 
library(peakPick)
library(shiny)
library(ggplot2)
library(signal)
ui <- fluidPage(
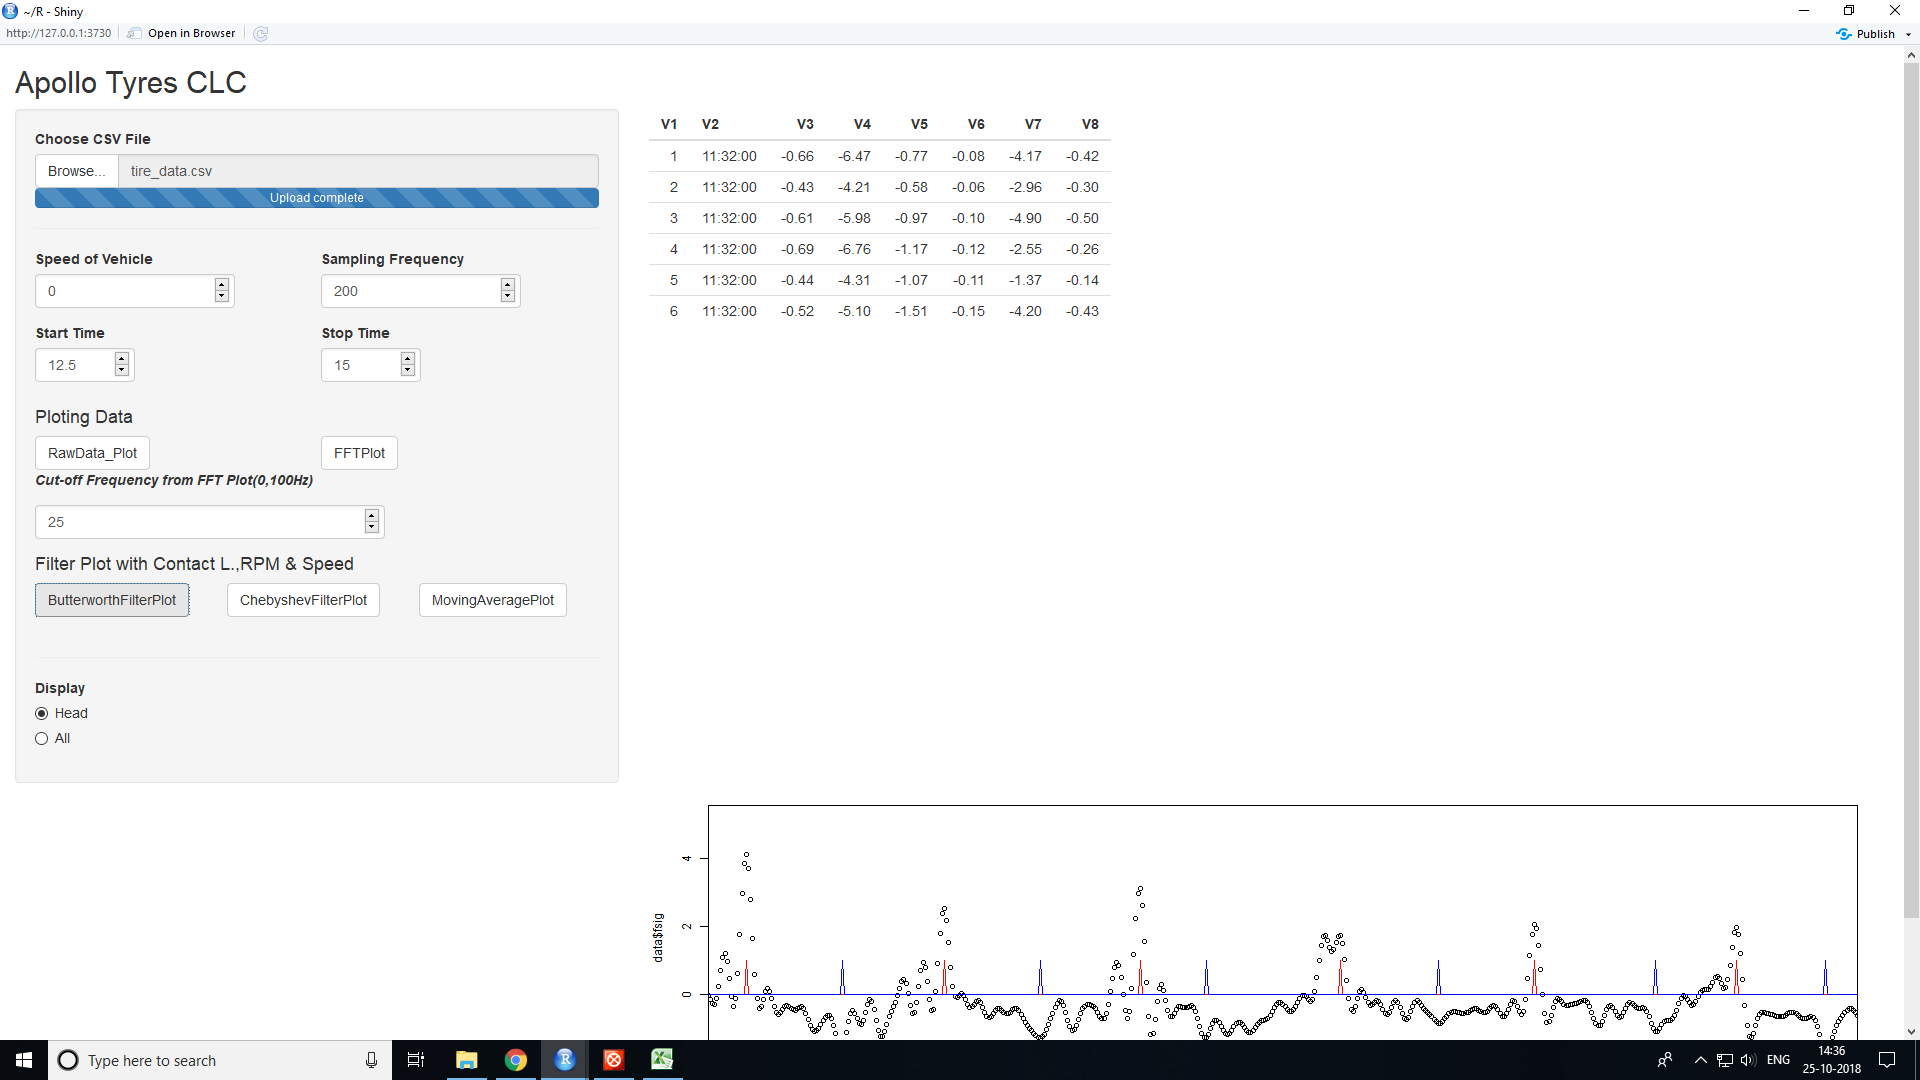
titlePanel("Apollo Tyres CLC "),
sidebarLayout(
sidebarPanel(
fileInput("file1", "Choose CSV File",
multiple = FALSE,
accept = c("text/csv",
"text/comma-separated-values,text/plain",
".csv")),
tags$hr(),
splitLayout(numericInput("speed", "Speed of Vehicle",0,width = "200px"),
numericInput("freq", "Sampling Frequency",200,width = "200px")),
splitLayout(numericInput("start","Start Time",12.5,width = "100px"),
numericInput("stop","Stop Time",15,width = "100px")),
strong(h4("Ploting Data")),
splitLayout(actionButton("rawdata","RawData_Plot"),
actionButton("fftdata","FFTPlot")),
numericInput("num", label = p(em("Cut-off Frequency from FFT Plot(0,100Hz)")),width = "350px",value = 25,min=0,max=100),
actionButton("bfilter","ButterworthFilterPlot"),
br(),
tags$hr(),
# Input: Select number of rows to display ----
radioButtons("disp", "Display",
choices = c(Head = "head",
All = "all"),
selected = "head")
),
# Main panel for displaying outputs ----
mainPanel(
# Output: Data file ----
tableOutput("contents"),
plotOutput("fftplot"),
plotOutput("btrplot"),
verbatimTextOutput("btrplotlc")
)
)
)
# Define server logic to read selected file ----
server <- function(input, output) {
output$contents <- renderTable({
# input$file1 will be NULL initially. After the user selects
# and uploads a file, head of that data file by default
# or all rows if selected, will be shown.
req(input$file1)
# when reading semicolon separated files,
# having a comma separator causes `read.csv` to error
tryCatch(
{
df <- read.csv(input$file1$datapath,
header = FALSE)
},
error = function(e) {
# return a safeError if a parsing error occurs
stop(safeError(e))
}
)
if(input$disp == "head") {
return(head(df))
}
else {
return(df)
}
})
#Plots out the FFT plot
fftplot <- eventReactive(input$fftdata, {
if (is.null(input$file1))
return()
infile <- input$file1
data <- read.csv(infile$datapath,header = F)
data$V3 = data$V3 - mean(data$V3) ##DC offset removal##
fftx = fft(data$V3) ##takes FFT##
magx = Mod(fftx[1:(length(fftx)/2)]) ##magnitude of FFT##
frequency = seq(0,100,length.out=length(magx)) ##frequency Range##
fftdf = data.frame(magx,frequency) ##making a data frame of freq and mag##
aabc = ggplot(fftdf,aes(x=frequency,y=magx,color=frequency))
aabc+ geom_line()
})
output$fftplot <- renderPlot({fftplot()})
#Plots out the filtered output using Butterworth filter
btrplot <- eventReactive(input$bfilter,{
if (is.null(input$file1))
return()
infile <- input$file1
data <- read.csv(infile$datapath,header = F)
tstart=input$start
tstop= input$stop
sfreq = input$freq
n=input$num
filter = butter(8,n/100,type="low")
fsig = signal::filtfilt(filter,data$V3)
data$fsig = fsig
plot(data$V1,data$fsig,xlim = c(tstart*sfreq,tstop*sfreq))
#peak detection
fsig = signal::filtfilt(filter,data$V3)
data$fsig = fsig
peaks = peakpick(matrix(fsig), neighlim=50, deriv.lim = 0.5, peak.min.sd = 0.1,peak.npos = 10L, mc.cores = 1)
lines(peaks,col='red',xlim=c( tstart*sfreq,tstop*sfreq))
posPeak = which(peaks == TRUE)
rangepos = subset(posPeak,posPeak>tstart*sfreq & posPeak<tstop*sfreq)
negfsig3 = -fsig
negpeaks = peakpick(matrix(negfsig3), neighlim=50, deriv.lim = 0.5, peak.min.sd = 0.1,peak.npos = 10L, mc.cores = 1)
lines(negpeaks, col = "blue",xlim=c( tstart*sfreq,tstop*sfreq))
negPeak = which(negpeaks==TRUE)
#Calculation of Contact Length
rangeneg = subset(negPeak,negPeak>tstart*sfreq & negPeak<tstop*sfreq)
if(rangeneg[1]>rangepos[1]){
if(length(rangeneg)==length(rangepos)){
index = rangeneg - rangepos
}
else{
rangepos2 = rangepos[1:(length(rangepos)-1)]
index = rangeneg - rangepos2
}
}
else{
if(length(rangeneg)==length(rangepos)){
rangeneg2 = rangeneg[2:length(rangeneg)]
rangepos2 = rangepos[1:length(rangepos)-1]
index = rangeneg2 - rangepos2
}
else{
rangeneg2 = rangeneg[2:length(rangeneg)]
index = rangeneg2 - rangepos
}
}
actspeedinkmph = 10
timeCL = mean(index)/sfreq
CL = timeCL * actspeedinkmph * 5/18
})
output$btrplot <- renderPlot({btrplot()})
#shows the contact length as output text
btrplotcl <- eventReactive(input$bfilter,{
if (is.null(input$file1))
return()
infile <- input$file1
data <- read.csv(infile$datapath,header = F)
tstart=input$start
tstop= input$stop
sfreq = input$freq
n=input$num
filter = butter(8,n/100,type="low")
fsig = signal::filtfilt(filter,data$V3)
data$fsig = fsig
peaks = peakpick(matrix(fsig), neighlim=50, deriv.lim = 0.5, peak.min.sd = 0.1,peak.npos = 10L, mc.cores = 1)
posPeak = which(peaks == TRUE)
rangepos = subset(posPeak,posPeak>tstart*sfreq & posPeak<tstop*sfreq)
negfsig3 = -fsig
negpeaks = peakpick(matrix(negfsig3), neighlim=50, deriv.lim = 0.5, peak.min.sd = 0.1,peak.npos = 10L, mc.cores = 1)
negPeak = which(negpeaks==TRUE)
#Calculation of Contact Length
rangeneg = subset(negPeak,negPeak>tstart*sfreq & negPeak<tstop*sfreq)
if(rangeneg[1]>rangepos[1]){
if(length(rangeneg)==length(rangepos)){
index = rangeneg - rangepos
}
else{
rangepos2 = rangepos[1:(length(rangepos)-1)]
index = rangeneg - rangepos2
}
}
else{
if(length(rangeneg)==length(rangepos)){
rangeneg2 = rangeneg[2:length(rangeneg)]
rangepos2 = rangepos[1:length(rangepos)-1]
index = rangeneg2 - rangepos2
}
else{
rangeneg2 = rangeneg[2:length(rangeneg)]
index = rangeneg2 - rangepos
}
}
actspeedinkmph = 10
timeCL = mean(index)/sfreq
CL = timeCL * actspeedinkmph * 5/18
show("CL")
})
output$btrplotcl <- renderText({btrplotcl()})
}
# Create Shiny app ----
shinyApp(ui, server)