| Month of attack2 | Count of Month of attack2 |
|---|---|
| January | 45 |
| February | 53 |
| March | 66 |
| April | 53 |
| May | 71 |
| June | 90 |
| July | 58 |
| August | 81 |
| September | 72 |
| October | 79 |
| November | 63 |
| December | 59 |
This makes a waffle chart with leopard emojis:
library(tidyverse)

df <- tribble(
  ~id, ~month, ~n,
  1, "January",	45,
  2, "February",	53,
  3, "March",	66,
  4, "April",	53,
  5, "May",	71,
  6, "June",	90,
  7, "July",	58,
  8, "August",	81,
  9, "September",	72,
  10, "October",	79,
  11, "November",	63,
  12, "December",	59
) %>%
  mutate( month = factor(month, levels = month.name))

waffle <- function(n) {
  expand_grid(x = 1:10, y = 1:10) %>%
  mutate(fill = row_number() <= n)
}

df %>%
  rowwise() %>%
  mutate(data = list(waffle(n))) %>%
  unnest(data) %>%
  select(month, x, y, fill) %>%
ggplot()+
  aes(x, y)+
  geom_text(aes(label = ifelse(fill == TRUE, "🐆", "")), size = 5)+
  theme_void()+
  facet_wrap(~month, ncol = 12, nrow = 1, strip.position = "bottom")+
  theme(
    plot.margin = margin(1, 1, 1, 1, "cm"),
    aspect.ratio = 1,
    strip.text.x.bottom = element_text(hjust = 0))
1 Like
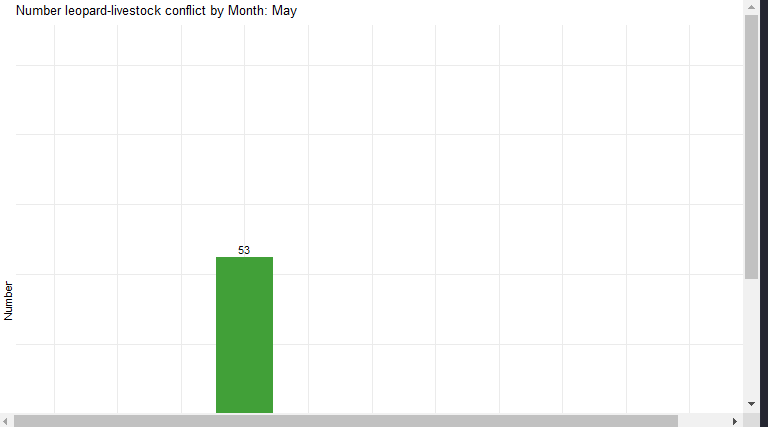
Maybe an animate plot could help you.
Using the @RupaliThakur tribble.
# libraries
library(ggplot2)
library(gganimate)
library(dplyr)

df <- tribble(
  ~id, ~month, ~n,
  1, "January", 45,
  2, "February", 53,
  3, "March", 66,
  4, "April", 53,
  5, "May", 71,
  6, "June", 90,
  7, "July", 58,
  8, "August", 81,
  9, "September", 72,
  10, "October", 79,
  11, "November", 63,
  12, "December", 59
) %>%
  mutate(month = factor(month, levels = month.name))

# animate plot
p <- ggplot(df, aes(x = month, y = n, fill = month)) +
  geom_col() +
  geom_text(aes(label = n), vjust = -0.5, size = 4) +
  scale_fill_brewer(palette = "Paired") +
  labs(
    title = "Number leopard-livestock conflict by Month: {closest_state}",
    x = "Month",
    y = "Number",
    fill = "Month"
  ) +
  theme_minimal() +
  theme(axis.text.x = element_text(angle = 45, hjust = 1)) +
  transition_states(
    states = month,
    transition_length = 2,
    state_length = 1
  ) +
  ease_aes('cubic-in-out')

# Render
animate(p, width = 800, height = 600, fps = 20, duration = 10)
1 Like
This topic was automatically closed 90 days after the last reply. New replies are no longer allowed.
If you have a query related to it or one of the replies, start a new topic and refer back with a link.