Hi,
maybe anybody know how to add borders to bars in plot.likert() function from HH package ?
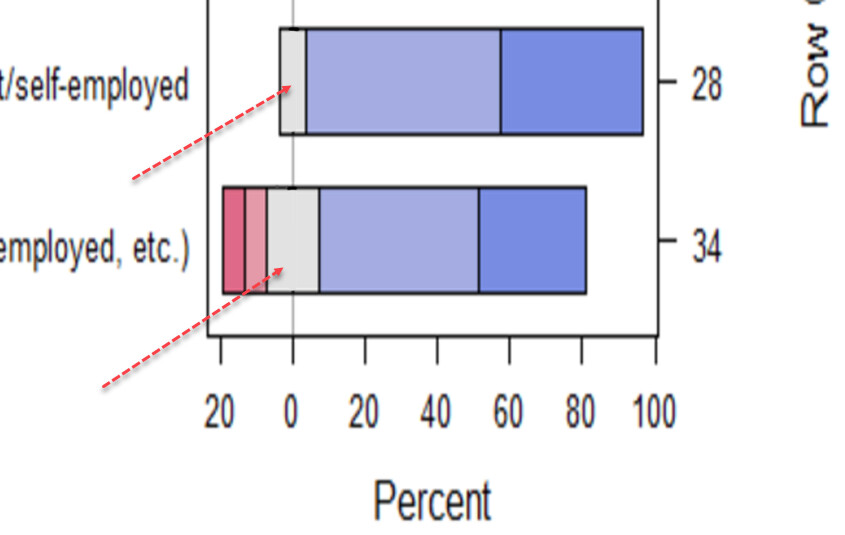
Here below there are some examples of Likert's plots. I would like to use plot.likert function not likert() function form HH package and add black outline to bars.
I have read that HH package uses lattice package under the hood especially barchart() function.
My question would be how to get to that function from HH package to modify bars ?
Another thing is that when I use this code:
library(HH)
data("ProfChal")

HH::likert(Question ~ . , ProfChal[ProfChal$Subtable=="Employment sector",],
       ylab=NULL,
       main = "",
       auto.key = list(columns = 1, reverse.rows = T),
       as.percent = T,
       borders = list()) # <- This draws borders around the bars in the plot
borders = list()) is used to draw borders around bars but somehow it always divides not necessarily center block (here No Opinion) in two parts. How to get rid of this center black line ?
library(HH)

data("ProfChal")

HH::likert(Question ~ . , ProfChal[ProfChal$Subtable=="Employment sector",],
       ylab=NULL,
       main = "",
       auto.key = list(columns = 1, reverse.rows = T),
       as.percent = T,
       borders = list()) # <- This draws borders around the bars in the plot