Edited:: to add aditional fill attribute to plotright
library(ggplot2)
library(dplyr) #not needed for plot, only for dummy data creation
#https://stackoverflow.com/questions/11053899/how-to-get-a-reversed-log10-scale-in-ggplot2
library("scales")
reverselog_trans <- function(base = exp(1)) {
trans <- function(x) -log(x, base)
inv <- function(x) round(base^(-x),digits=2)
trans_new(paste0("reverselog-", format(base)), trans, inv,
log_breaks(base = base),
domain = c(1e-100, Inf))
}
#This is dummy data, load your data here with read.csv
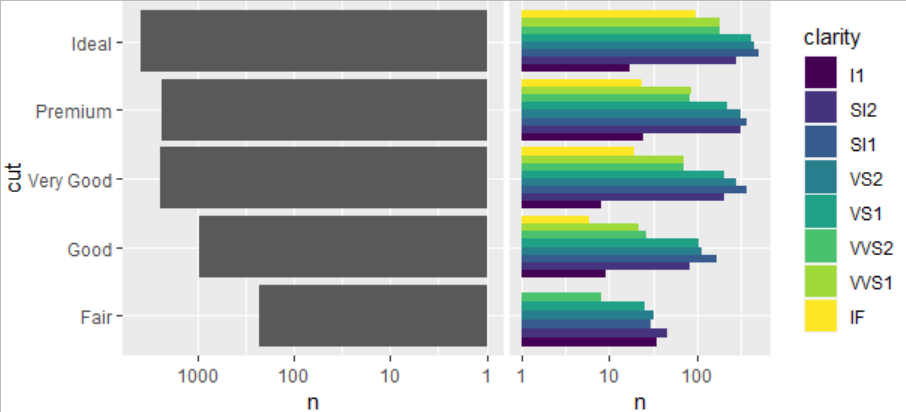
plotData_left = diamonds %>% filter(color=="E") %>% group_by(cut) %>% summarise(n = n())
plotData_right = diamonds %>% filter(color=="I") %>% group_by(cut,clarity) %>% summarise(n = n())
(gleft<-ggplot(plotData_left, aes(x = cut, y = n)) +
geom_bar(stat = "identity") + coord_flip() +
scale_y_continuous(trans=reverselog_trans(10)) +
theme(plot.margin = unit(c(0, 0, 0, 0), "cm")))
(gright<-ggplot(plotData_right, aes(x = cut, y = n,fill=clarity)) +
geom_bar(stat = "identity",position = "dodge") + coord_flip() +
scale_y_log10() + theme(axis.title.y = element_blank(),
axis.ticks.y = element_blank(),
axis.text.y = element_blank(),
plot.margin = unit(c(0, 0, 0, 0), "cm")))
library(cowplot)
cowplot::plot_grid(gleft,gright,
nrow=1,ncol=2,rel_widths = c(5,4)) # play with this till aligned