Heya all,
How do I graph a horizontal bar chart on the logarithmic axis?
is there a way to do it using ggplot2?
The input data is in a csv
Heya all,
How do I graph a horizontal bar chart on the logarithmic axis?
is there a way to do it using ggplot2?
The input data is in a csv
Hi,
Welcome to the RStudio community!
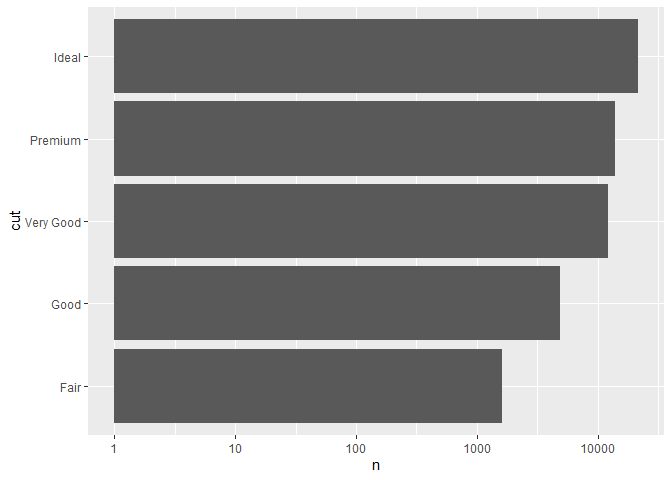
Here is an example:
library(ggplot2)
library(dplyr) #not needed for plot, only for dummy data creation

#This is dummy data, load your data here with read.csv
plotData = diamonds %>% group_by(cut) %>% summarise(n = n())

ggplot(plotData, aes(x = cut, y = n)) +
  geom_bar(stat = "identity") + coord_flip() + scale_y_continuous(trans='log10')
Created on 2020-07-31 by the reprex package (v0.3.0)
Hope this helps,
PJ
Hi Pieterjanvc
Thanks for welcoming me!!
I need more help in with this graph ![]()
I need it to be a back to back bar chart. on the Left hand side there is only 1 value but on the right hand side it has 3 values 3 bars... ![]()
I have a csv file and that csv file has all the data already in the correct columns. so don't need to do any group by or tally.
In the CSV File there are 5 columns.
A B C D E
Coln A is the title for each bar
Coln B is the score that goes to the LEFT hand side
C D E goes to the right hand side (multiple bars) not stacked bar
Coln F is called Graph so I can use that to sort and put one graph on top and one graph on the bottom. within the same graph.
Here is a link to what the finished graph should look like
input_data <- read.csv(file.path("INPUT.csv"), TRUE, ",")

#check data is data frame, should print out TRUE
is.data.frame(input_data)

#Sort data by Graph coln, (top half and bottom half) then by Score (BottomHalf graph will be at the bottom)
selected_data <- input_data %>% arrange(Graph,desc(Score))
I got this far so far but then I don't know where to start to make the graph.
Also you see I have used arrange() verb of dplyr but I looked at the data it is already sorted in the csv file.
Here is what the data looks like:
https://ibb.co/h8ppg3B
Blue value goes to the Left hand side
and orange values go to the right hand side
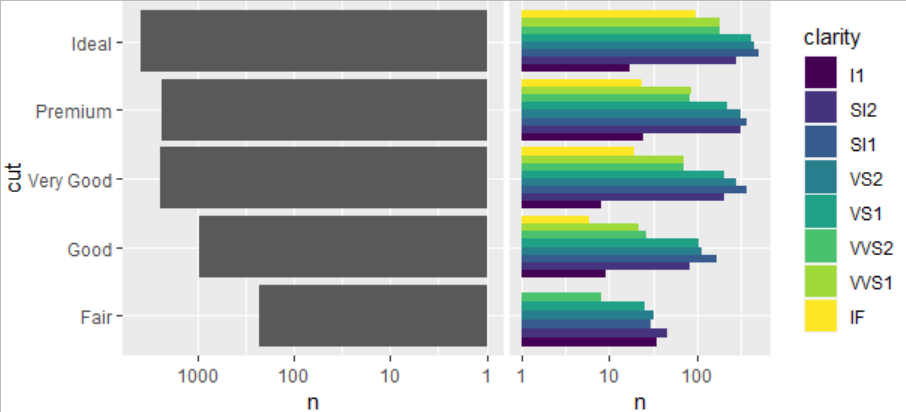
Edited:: to add aditional fill attribute to plotright
library(ggplot2)
library(dplyr) #not needed for plot, only for dummy data creation

#https://stackoverflow.com/questions/11053899/how-to-get-a-reversed-log10-scale-in-ggplot2
library("scales")
reverselog_trans <- function(base = exp(1)) {
  trans <- function(x) -log(x, base)
  inv <- function(x) round(base^(-x),digits=2)
  trans_new(paste0("reverselog-", format(base)), trans, inv,
           log_breaks(base = base),
            domain = c(1e-100, Inf))
}
#This is dummy data, load your data here with read.csv
plotData_left = diamonds %>% filter(color=="E") %>% group_by(cut) %>% summarise(n = n())
plotData_right = diamonds %>% filter(color=="I") %>% group_by(cut,clarity) %>% summarise(n = n())

(gleft<-ggplot(plotData_left, aes(x = cut, y = n)) +
    geom_bar(stat = "identity") + coord_flip()  +
    scale_y_continuous(trans=reverselog_trans(10)) +
    theme(plot.margin = unit(c(0, 0, 0, 0), "cm")))

(gright<-ggplot(plotData_right, aes(x = cut, y = n,fill=clarity)) +
    geom_bar(stat = "identity",position = "dodge") + coord_flip()  +
    scale_y_log10() + theme(axis.title.y = element_blank(),
                            axis.ticks.y = element_blank(),
                            axis.text.y = element_blank(),
  plot.margin = unit(c(0, 0, 0, 0), "cm")))

library(cowplot)

cowplot::plot_grid(gleft,gright,
                   nrow=1,ncol=2,rel_widths = c(5,4)) # play with this till aligned
Hi nirgrahamuk
THIS IS PERFECT I will be able to edit from here. thanks all for your time and help!!!!!!!!!
I got everything to work however the bars are not in the order of the value instead it's ordered by the cut. I want to do desc by n. descending order.
How do I order it by n?
because the levels of clarity don't agree across cut; I chose Ideal cut to define an ordering
plotData_right_ideal <- arrange(plotData_right, n) %>%
 filter(cut=="Ideal")

(clarity_levels <- pull(plotData_right_ideal,clarity)%>%
    as.character %>% forcats::as_factor())

plotData_right$clarity <- factor(plotData_right$clarity,
clarity_levels)This topic was automatically closed 7 days after the last reply. New replies are no longer allowed.