Please help me to understand how I can efficiently tidy this data. I'm given data in MS Excel. It is a very wide table. I am comfortable being able to read each of the Excel sheets into R (I would use readxl::read_excel).
My issue is, it seems that for me to turn this abomination of data into something useable I must spend a great deal of time to tidy it. I'm sure there is a better way than what I have attempted.
Launch the reprex!
# set up
library(here)
#> here() starts at C:/Users/renedherrera/AppData/Local/Temp/Rtmps3EihZ/reprex31ecd507146
library(tidyverse)
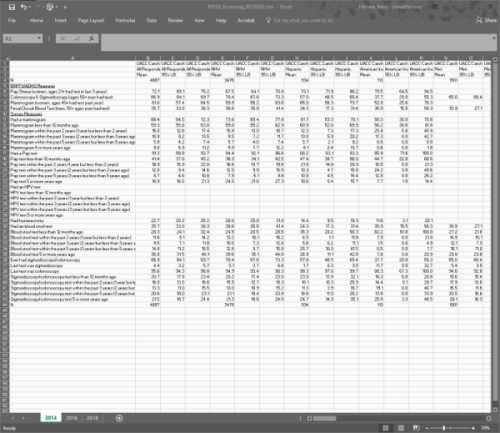
# how to efficiently take data that looks like this (much wider in real life)
df <- tribble(
~na, ~area_1, ~area_1_1, ~area_1_2, ~area_1_3, ~area_1_4, ~area_1_5, ~area_1_6, ~area_1_7, ~area_1_8, ~area_1_9, ~area_1_10, ~area_1_11, ~area_2_1, ~area_2_2, ~area_2_3, ~area_2_4, ~area_2_5, ~area_2_6, ~area_2_7, ~area_2_8, ~area_2_9, ~area_2_10, ~area_2_11, ~area_2,
"na", "demographic_1", "demographic_1", "demographic_1", "demographic_2", "demographic_2", "demographic_2", "demographic_3", "demographic_3", "demographic_3", "demographic_4", "demographic_4", "demographic_4", "demographic_1", "demographic_1", "demographic_1", "demographic_2", "demographic_2", "demographic_2", "demographic_3", "demographic_3", "demographic_3", "demographic_4", "demographic_4", "demographic_4",
"na", "estimate", "ci_min", "ci_max", "estimate", "ci_min", "ci_max", "estimate", "ci_min", "ci_max", "estimate", "ci_min", "ci_max", "estimate", "ci_min", "ci_max", "estimate", "ci_min", "ci_max", "estimate", "ci_min", "ci_max", "estimate", "ci_min", "ci_max",
"variable_1", "72.1", "69.1", "75.2", "67.5", "64.1", "70.8", "79.1", "71.9", "86.2", "79.5", "64.5", "94.5", "72.6", "67.4", "77.7", "70.9", "65.9", "75.9", "73.3", "60.3", "86.4", "81.3", "50.6", "100.0",
"variable_2", "66.9", "64.1", "69.7", "70.4", "67.6", "73.3", "57.0", "48.5", "65.4", "37.7", "20.0", "55.3", "71.0", "66.1", "76.0", "72.9", "68.3", "77.4", "64.9", "48.9", "81.0", "17.0", "0.0", "41.3",
"variable_3", "61.0", "57.4", "64.5", "59.9", "56.2", "63.6", "65.0", "56.3", "73.7", "52.0", "25.6", "78.3", "64.6", "58.8", "70.5", "64.8", "59.0", "70.6", "65.4", "50.4", "80.5", "42.5", "0.0", "100.0",
"variable_4", "35.7", "33.0", "38.3", "38.6", "35.8", "41.4", "24.3", "17.3", "31.4", "35.9", "15.5", "56.3", "39.2", "34.5", "43.9", "40.5", "35.9", "45.2", "29.3", "16.1", "42.4", "66.0", "23.1", "100.0",
"variable_5", "68.4", "64.5", "72.3", "73.6", "69.4", "77.8", "61.7", "53.3", "70.1", "50.3", "30.0", "70.6", "71.5", "65.0", "78.0", "75.9", "69.1", "82.6", "66.6", "52.2", "81.0", "42.7", "2.9", "82.5"
) %>%
mutate(year = "year_1")
# into tidy data that looks like this
# make ideal df
tidy_df <- tribble(
~year, ~variables, ~areas, ~demographics, ~estimates, ~estimate_ci_min, ~estimate_ci_max,
"year_1", "variable_1", "area_1", "demographic_1", 72.1, 69.1, 75.2,
"year_1", "variable_1", "area_1", "demographic_2", 67.5, 64.1, 70.8,
"year_1", "variable_1", "area_2", "demographic_1", 72.1, 69.1, 75.2,
"year_1", "variable_1", "area_2", "demographic_2", 67.5, 64.1, 70.8,
"year_1", "variable_2", "area_1", "demographic_1", 72.1, 69.1, 75.2,
"year_1", "variable_2", "area_1", "demographic_2", 67.5, 64.1, 70.8,
"year_1", "variable_2", "area_2", "demographic_1", 72.1, 69.1, 75.2,
"year_1", "variable_2", "area_2", "demographic_2", 67.5, 64.1, 70.8,
) # and so on, much longer in real life
# I have tried to do it this way
# select the columns by grouping
df_area_1 <- df %>%
select("na",
starts_with("area_1")) %>%
mutate(year = "year_1", # add columns to identify variables
area = "area_1")
# rename, slice, and pivot for each grouping
df_area_1 <- df_area_1 %>%
rename(
"demographic_1" = "area_1",
"demographic_2" = "area_1_3",
"demographic_3" = "area_1_6",
"demographic_4" = "area_1_9"
) %>%
slice(3:7) %>%
pivot_longer(
cols = c(2,5,8,11),
names_to = "demographic",
values_to = "estimate"
)
# and repeat until I am ready for a full_join