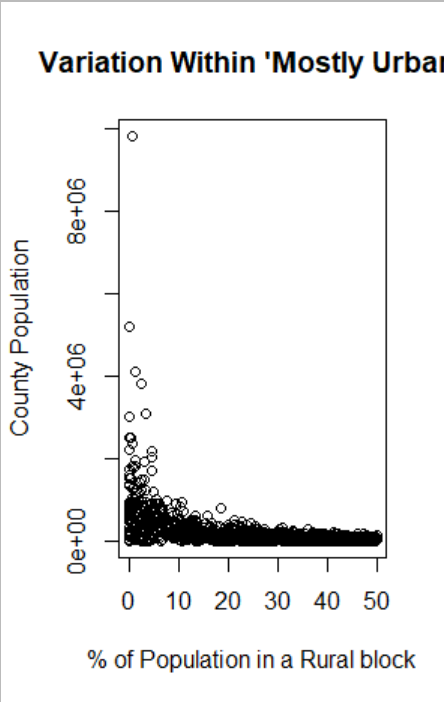
I'm trying to format a simple scatter plot in two ways: first, the title is getting cut off so how can I better center it?
secondly, I'd like to convert the y axis units to thousands to make it easier to read.
How can I do this?
Here is my code
 plot(most.urb$`2010.Census.Total.Population` ~ most.urb$`2010.Census.Percent.Rural`,
+      main="Variation Within 'Mostly Urban'", xlab="% of Population in a Rural block", ylab="County Population")
You can add a line break to a title with \n and you can directly scale the vectors used in the plot.
plot(DF$A/1000 ~ DF$B, main = "Rather Long Title\nWith Line Break")
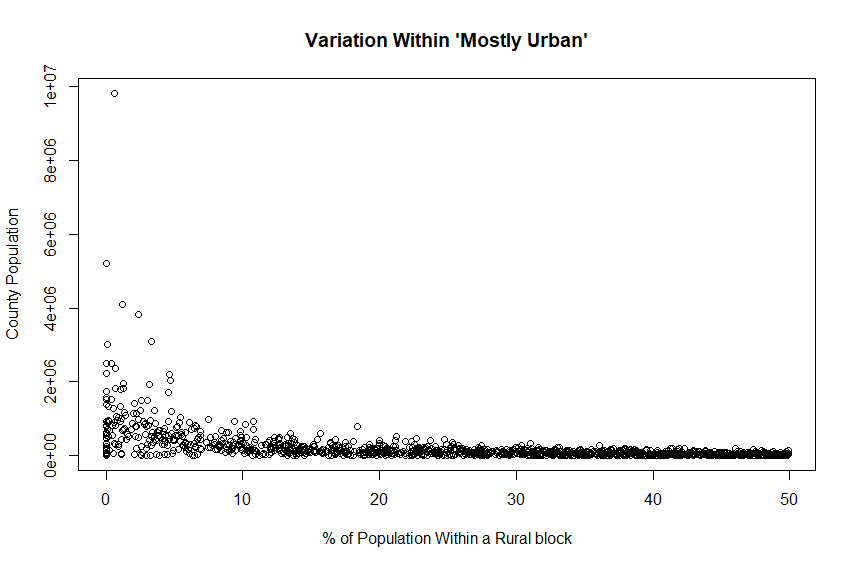
The aspect ratio of you plot looks unusual. Are you using the plotting pane of RStudio or something else to display the plot? There are commands to open a dedicated plot graphics window. On a Windows system you can use
windows(width = 9, height = 6)
and tune the width and height values. On Linux, I believe the function is x11().
Please show the actual command you are using to make the plot.
Oh, I see it. Try
plot(most.urb$`2010.Census.Total.Population`/1000 ~ most.urb$`2010.Census.Percent.Rural`,
     main="Variation Within 'Mostly Urban'", xlab="% of Population in a Rural block", ylab="County Population")
you could try ggplot which works nicely with scales etc.
ggplot(data=most.urb,
       mapping=aes(x=`2010.Census.Percent.Rural`,
                   y=`2010.Census.Total.Population` /1000))+geom_point() +
  scale_y_continuous(label=scales::unit_format(unit='k',big.mark = ",")) +
   xlab("% of Population in a Rural block") +
   ylab("County Population") +
  ggplot2::ggtitle(label="Variation Within 'Mostly Urban'")