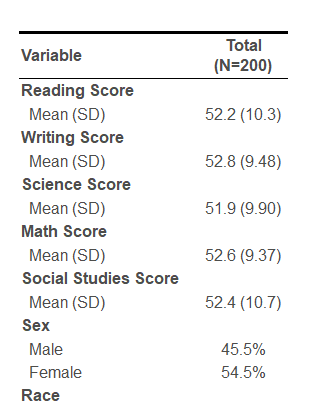
I'm currently trying to figure out the table1 function, namely how to name and obtain 2 columns in my descriptive data table: one column for the Mean (SD) of my continuous variables, and one for the %s for my categoricals. However, I don't want these values to be in the same column, if that makes sense. How would I go about doing this with the table1 package? My table currently looks like this.
You can try and get more help by posting the data and code you used to create your table, or calculate your statistics by hand and investigate other ways to put those values into a suitable formatted table using one of these packages: gt, flextable, huxtable, xtable, kableExtra, tables.