I'm trying to create a stacked barchart but i cant get it to work.
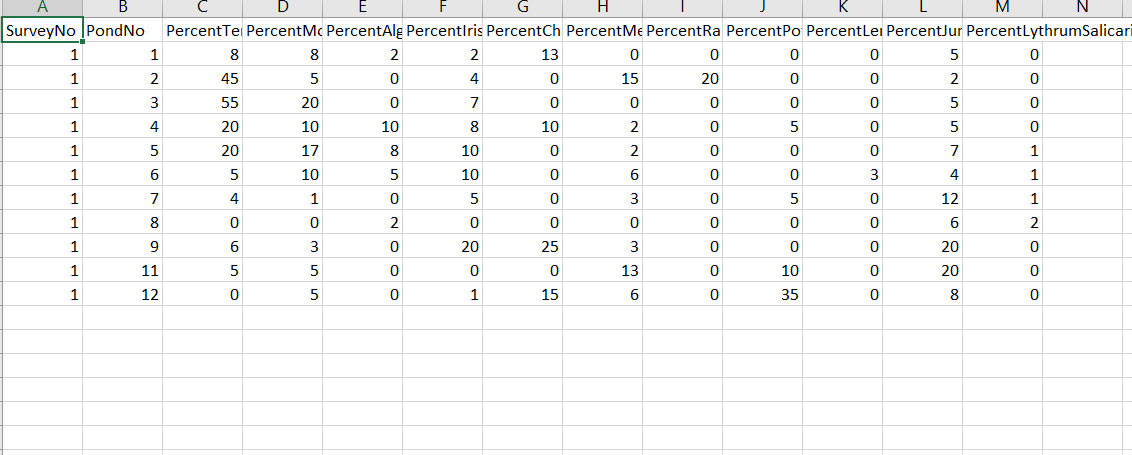
I took some percentages of aquatic plants and how much each species covered the pond water surface. I have 11 ponds in total and I wanted to compare what was seen in each pond by using the stacked barchart.
I've added a picture of the data im using, i have a lot more but i tried to make it smaller so its easier to use.
i'm not a pro at coding but i do have ggplot installed.
i want each bar to be a pond number then within each bar i want the percent of each plant seen.
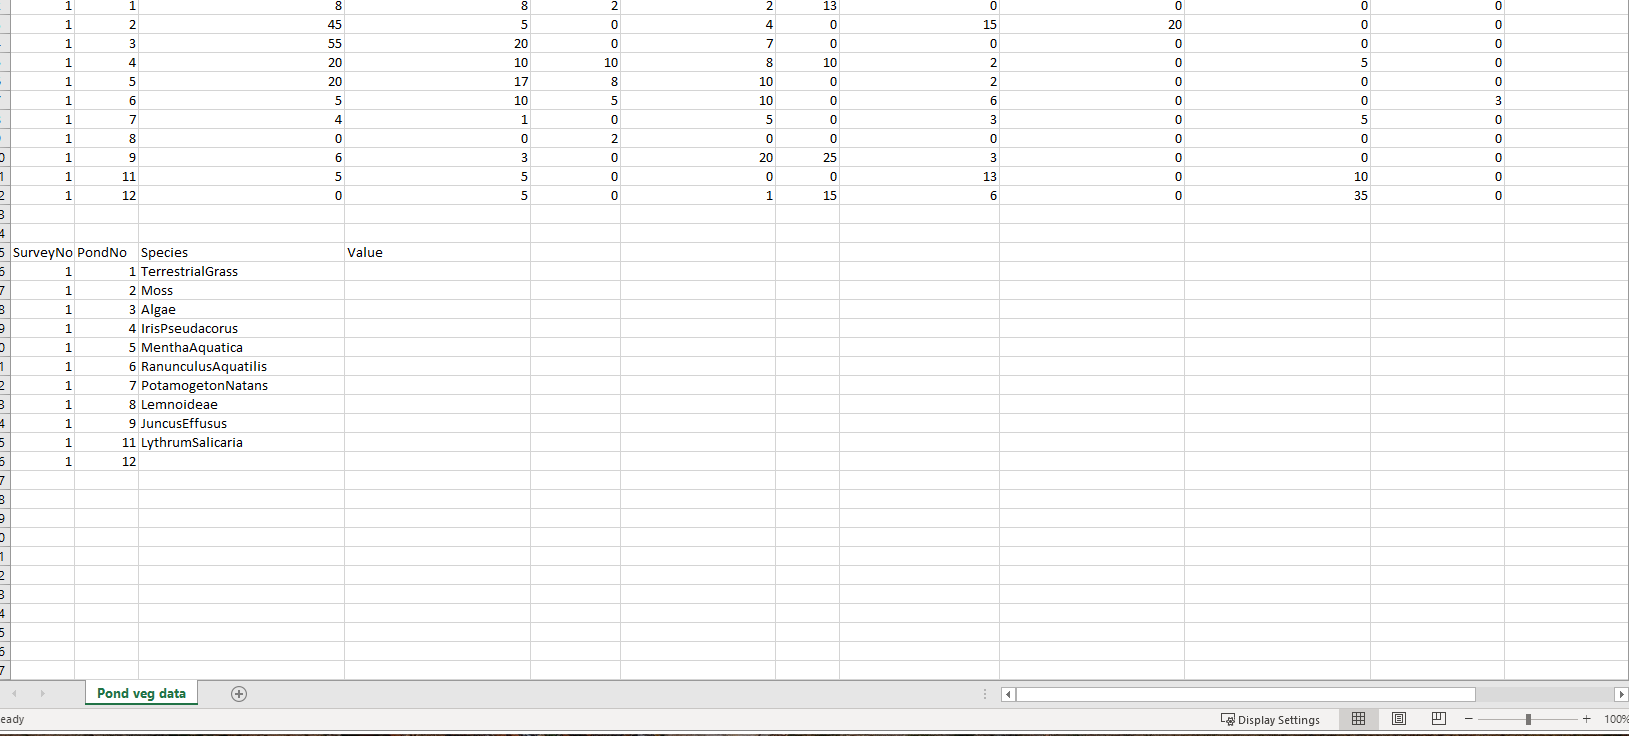
thanks for getting back to me! i've never used tidyr before so im unsure how to reshape data so i tried in excel. Since there is multiplpe values for each species i'm unsure what im meant to put in the value column you suggested. i tried it in the bottom left of the photo (when uploadinig to r i would put it in its own excel doc).