Hi all,
I've been struggling with making a graph. In this ridgeplot, I would like to mark an X value, for each category on the Y axis.
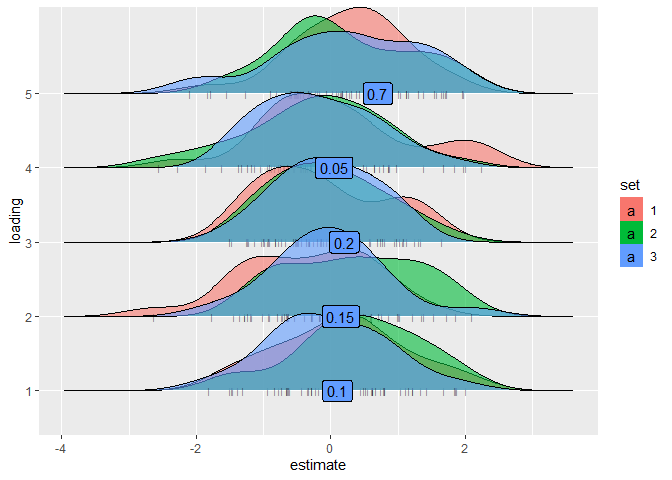
I've been toying with geom_label. But this only gives me a label (well, its in the name I guess ![]() ). And this label somehow takes on one of the fill values.
). And this label somehow takes on one of the fill values.
So I suppose my question is; in the plot the code generates:
- is it possible to add a marking on every ridge, corresponding to the "pop" value?
- if not, can I let the label show up in white? Or in a different shape of box?
Thanks!
library(tidyverse)
library(ggridges)
dfs <-
data.frame(
"estimate" = rnorm(300),
"loading" = factor(rep(1:5, 60)),
"set" = factor(rep(1:3, 100),),
"pop" = rep(c(0.1, 0.15, 0.20, 0.05, 0.7), 60)
)
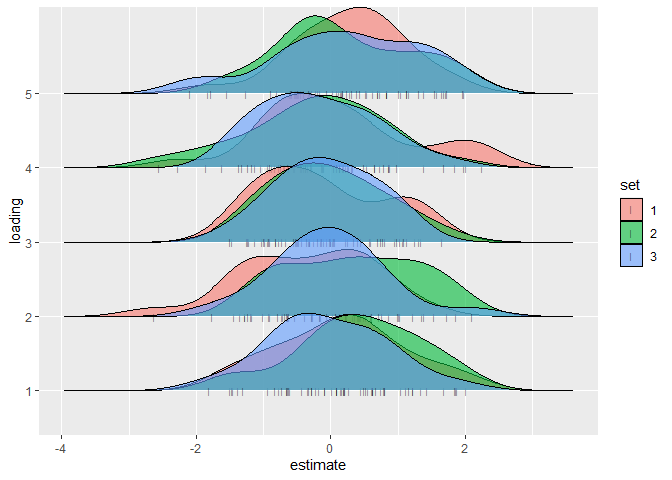
ggplot(dfs, aes(x = estimate, y = loading, fill = set)) +
geom_density_ridges(
jittered_points = TRUE,
point_shape = "|", point_size = 2, size = 0.25,
position = position_points_jitter(height = 0), alpha = 0.6, scale = 1.2)
#> Picking joint bandwidth of 0.445
loadsummary2 <- crossing("set" =  dfs$set, "loading" = dfs$loading)
loadsummary2$pop <- rep(c(0.1, 0.15, 0.20, 0.05, 0.7), 3)

ggplot(dfs, aes(x = estimate, y = loading, fill = set)) +
  geom_density_ridges(
    jittered_points = TRUE,
    point_shape = "|", point_size = 2, size = 0.25,
    position = position_points_jitter(height = 0), alpha = 0.6, scale = 1.2) +
    geom_label(data = loadsummary2, aes(y = loading, x = pop), label = loadsummary2$pop)
#> Picking joint bandwidth of 0.445
Created on 2020-03-13 by the reprex package (v0.3.0)