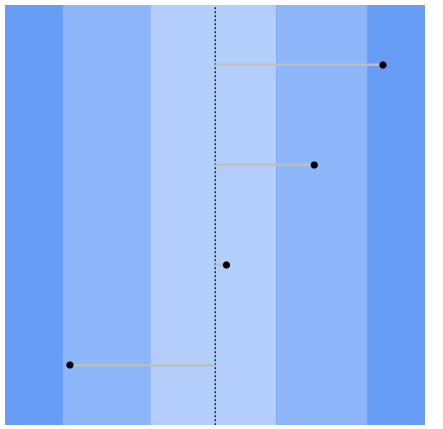
I'm trying to create a plot like the following
I wrote the following code that is not working:
fake_data <- tibble(y = c("y1", "y2", "y3", "y4"),
                    x = c(0.12, 0.53, 0.76, 0.94))

likelihood_areas <- tibble(xmin =c(-Inf, 0.1, 0.33, 0.66, .9),
                           xmax =c(0.1, 0.33, 0.66, 0.9, Inf),
                           ymin = rep(-Inf,5),
                           ymax = rep(Inf,5),
                           likelihood = c("Very", "Likely", "About as likely as not", "Likely", "Very"),
                           color = c("#2196f3", "#42a5f5", "#90caf9", "#42a5f5", "#2196f3"))

ggplot(data = fake_data, aes(x = x, y = y)) +
  geom_rect(data = likelihood_areas, aes(xmin = xmin, xmax = xmax, ymin = ymin, ymax = ymax, fill = color))  +
  geom_vline(xintercept = 0.5, linetype = "dashed") +
  geom_point(size = 3) +
  geom_segment(x = 0.5, aes(xend = x, y = y, yend = y)) +
  scale_fill_identity() +
  theme_void() +
  coord_cartesian(xlim =c(0, 1))

ERROR while rich displaying an object: Error in `geom_rect()`:
! Problem while computing aesthetics.
ℹ Error occurred in the 1st layer.
Caused by error in `FUN()`:
! object 'x' not found
What am I doing wrong with geom_rect? Thanks!