jj2528
May 17, 2022, 12:53am
1
Hi everyone, I am new to R and need help adding error bars to my graphs.
What I used to create the graphs:
library(ggplot2)
df <- deadcell
df$Conc <- as.factor(df$Conc)
bp <- ggplot(df, aes(x = Conc, y = Values, group = Media, color = Genotype)) +
bp + facet_wrap(Media~Toxin) +
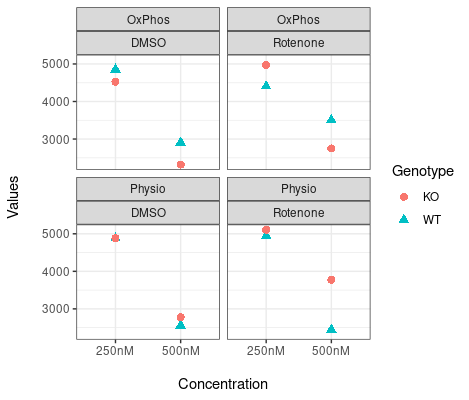
What my graphs look like. I just need to add error bars. Any help I would appreciate.
FJCC
May 17, 2022, 2:00am
2
What do you want the error bars to represent? You have 16 rows of data and you are plotting 16 points. I do not see an obvious basis for error bars.
SD, I have another column with their SD, I just need the proper command to to incorporate into this graph. Each point will have its own SD. Thanks!
FJCC
May 17, 2022, 2:31am
4
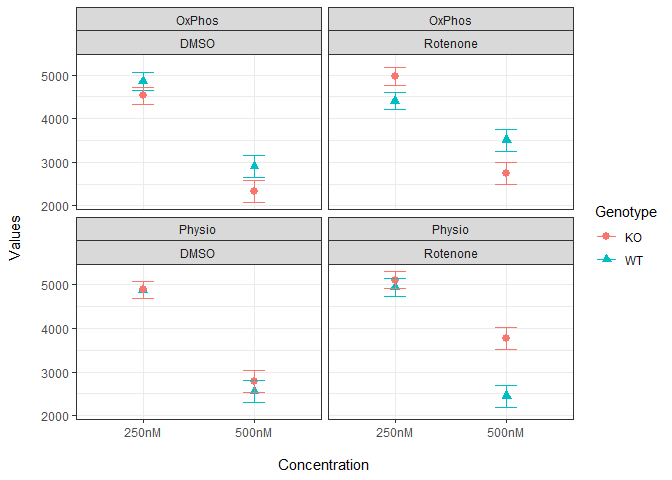
I added an SD column with invented values. The following shows the simplest implementation of error bar.
library(ggplot2)
df <- read.csv("~/R/Play/Dummy1.csv",sep = "|")
df
#>      Values  Conc  Media    Toxin Genotype  SD
#> 1  4878.833 250nM Physio     DMSO       WT 200
#> 2  4884.833 250nM Physio     DMSO       KO 200
#> 3  4854.167 250nM OxPhos     DMSO       WT 200
#> 4  4526.833 250nM OxPhos     DMSO       KO 200
#> 5  4943.500 250nM Physio Rotenone       WT 200
#> 6  5108.167 250nM Physio Rotenone       KO 200
#> 7  4404.833 250nM OxPhos Rotenone       WT 200
#> 8  4970.833 250nM OxPhos Rotenone       KO 200
#> 9  2558.167 500nM Physio     DMSO       WT 250
#> 10 2776.833 500nM Physio     DMSO       KO 250
#> 11 2906.500 500nM OxPhos     DMSO       WT 250
#> 12 2319.667 500nM OxPhos     DMSO       KO 250
#> 13 2446.167 500nM Physio Rotenone       WT 250
#> 14 3772.667 500nM Physio Rotenone       KO 250
#> 15 3505.667 500nM OxPhos Rotenone       WT 250
#> 16 2749.167 500nM OxPhos Rotenone       KO 250
df$Conc <- as.factor(df$Conc)
df$Media <- as.factor(df$Media)
df$Toxin <- as.factor(df$Toxin)
df$Genotype <- as.factor(df$Genotype)
bp <- ggplot(df, aes(x = Conc, y = Values, group = Media, color = Genotype)) +
  geom_point(aes(fill = Genotype, shape = Genotype), size = 2.5) +
  geom_errorbar(aes(ymin = Values - SD, ymax = Values + SD), width = 0.2)

bp + facet_wrap(Media~Toxin) +
  theme(strip.text.x = element_text(face = "bold"),
        axis.title.x = element_text(face = "bold"),
        axis.title.y = element_text(face = "bold")) +
  labs(x = "\nConcentration", y = "Values\n") + theme_bw()
Created on 2022-05-16 by the reprex package (v2.0.1)
SD, I have another column with their SD, I just need the proper command to to incorporate into this graph. Each point will have its own SD. Thanks!