Hi
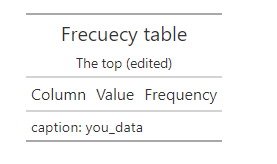
I tried to run it, but the table is just showing this (nothing inside).
Do you know why?

Also there seems to be no data inside results_df
> results_df
[1] Column    Value     Frequency
<0 rows> (or 0-length row.names)
So I now have this test code (this is my file). Do you see any mistake?
# install packages and load data
install.packages('tidyverse')
install.packages('readxl')
### Table
install.packages('gt')


# load the packages
library(tidyverse)
library(readxl)
library(gt)

# Read Excel file into a data frame
# data_excel <- read_excel("F:\\a\\games.xlsx", sheet = 1) # Change you path

## Example of data
data_excel <- data.frame(
  A = c("apple", "banana", "apple", "apple", "banana", "orange", "apple", "banana", "orange", "orange"),
  B = c(1, 2, 2, 3, 1, 3, 2, 3, 1, 1),
  C = c("red", "red", "blue", "green", "red", "green", "blue", "red", "green", "blue"))

# Define a function to calculate the top 3 most frequent values in a column
get_top_frequencies <- function(column) {
  column %>%
    as.factor() %>%               # Convert column to factor (useful for counting levels)
    table() %>%                   # Count frequency of each value
    sort(decreasing = TRUE) %>%   # Sort in descending order of frequency
    head(3)                       # Get top 3 most frequent values
}

# For get a friendly output, use this:
results_df <- data.frame(Column = character(),
                         Value = character(),
                         Frequency = integer(),
                         stringsAsFactors = FALSE)

# Loop through each column in the data frame
for(col_name in names(df)) {
  # Get the top 3 most frequent values for the current column
  top_vals <- get_top_frequencies(df[[col_name]])

  # Create a temporary data frame with the results
  temp_df <- data.frame(
    Column = col_name,
    Value = names(top_vals),
    Frequency = as.integer(top_vals),
    stringsAsFactors = FALSE
  )

  # Bind the temporary data frame to the results data frame
  results_df <- bind_rows(results_df, temp_df)}

results_df
# Column  Value Frequency
#   A   apple          4
#   A   banana         3
#   A   orange         3
#   B      1           4
#   B      2           3
#   B      3           3
#   C    red           4
#   C    blue          3
#   C   green          3


results_df <- results_df |> tibble()

gt_tbl <- gt(results_df)

gt_tbl <-
  gt_tbl |>
  tab_header(
    title = "Frecuecy table",
    subtitle = "The top (edited)") |>
  tab_source_note(source_note = "caption: you_data")
gt_tbl

