Hey guys, i somehow cant fit my train data. I always get this error. "Error in eval(predvars, data, env) : object 'X1' not found" I dont really know why. Please help me.
This is my code:
# Daten einlesen
diabetes<-read.csv(url('https://raw.githubusercontent.com/jbrownlee/Datasets/master/pima-indians-diabetes.data.csv'))
table(diabetes$X1)
prop.table(table(diabetes$X1))
barplot(table(diabetes$X1))

# Daten splitten
index <- createDataPartition(diabetes$X1, p = 0.8, list = FALSE)
train_data <- elena[index, ]
test_data  <- elena[-index, ]

# Confusion-Matrix für Test-Data
library(rpart)
library(caret)
library(e1071)
fit_train <- rpart(X1~., data = train_data, method = "class", control = rpart.control(cp = 0))
rpart.plot(fit_train, extra=4)
printcp(fit_train)
plotcp(fit_train)
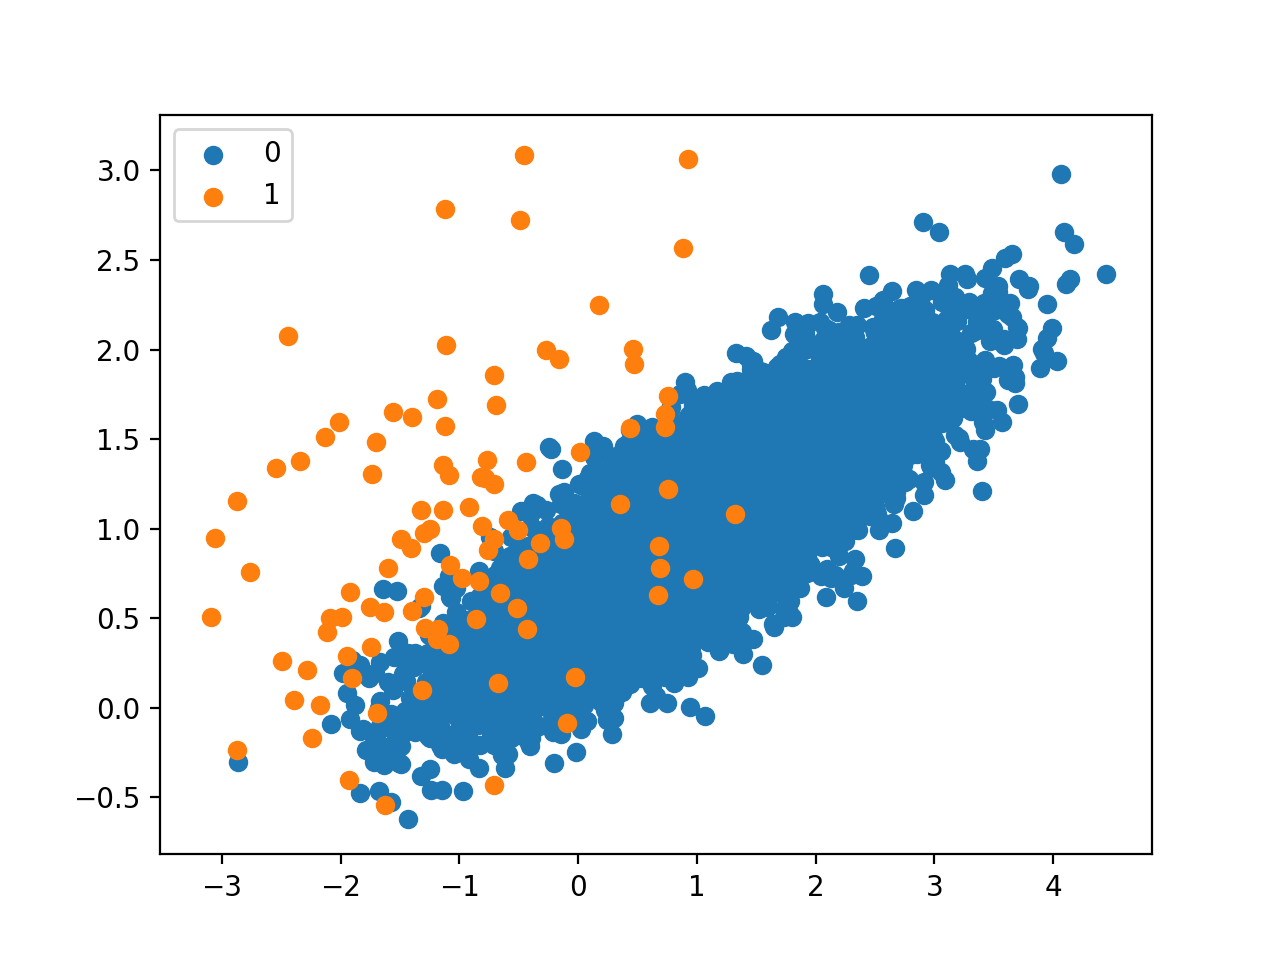
OMG, yeah i messed up. I got it fixed. I just needed to replace elena with diabetes. Do you also know how to plot this dataset like in this picture shown?
The target variable should be X1. The other ones dont really matter. Chose any you want. I just want to know the Code. Later i will chose the best variables. Chose any one you want. And is it possible to highlight each class in a different color?
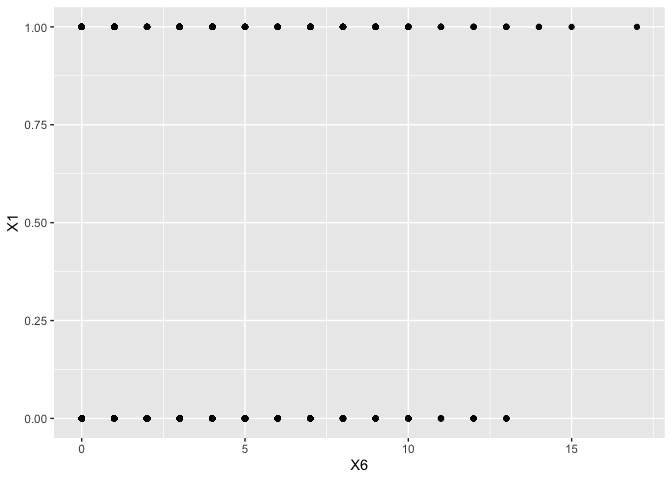
I don't think you want a binary response (target) variable.
suppressPackageStartupMessages(library(ggplot2))
diabetes<-read.csv(url('https://raw.githubusercontent.com/jbrownlee/Datasets/master/pima-indians-diabetes.data.csv'))
p <- ggplot(diabetes, aes(,X1))
p + geom_point(aes(X6))
@technocrat Okay sure, do you know how i create such a plot like the one above with this dataset. I want to illustrate the imbalance in the target variable.
An imbalance of X0 in the might be better illustrated as a bar graph of the proportion of 1s by covariates. X \sim X_i is always going to look like the example.