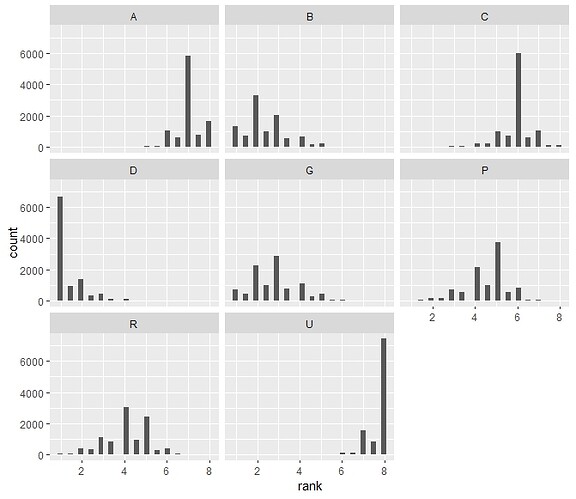
I have a sports league in which I want to calculate the promotion probabilities of each team according to their current situation and the remaining matches. First time playing with simulations.
The current standings are as follows:
1 D 61
2 B 58
3 G 57
4 R 54
5 P 53
6 C 49
7 A 45
8 U 42
The first column is the current position, the second the team and the third the points they have right now. Bearing in mind that there are seven games left to play (1 point more for draw, 3 for win), I want to find:
- Probabilities in percentage that each of the eight teams will finish in position 1.
- Odds of each team in percentage of finishing between places 2 and 5.
- Odds of each team finishing in 2nd place, 3rd place, 4th place and 5th place.
I understand that a Monte Carlo simulation would be the most appropriate.
My first steps:
teams <- c("D", "B", "G", "R", "P", "C", "A", "U")
initial_points <- c(61, 58, 57, 54, 53, 49, 45, 42)
remaining_games <- 7
num_simulations <- 10000
I have defined a function for simulation:
simulation <- function(starting_points, remaining_games, num_simulations) {
        results <- matrix(0, nrow = num_simulations, ncol = length(initial_points))

        for (simulation in 1:num_simulations) {
                simulation_points <- initial_points

                # We adjust the starting points according to the starting position of the teams.
                simulation_points <- simulation_points + sample(0:3, length(initial_points), replace = TRUE, prob = c(0.1, 0.3, 0.4, 0.2))

                for (match in 1:remaining_games) {
                        match_results <- sample(0:3, length(initial_points), replace = TRUE, prob = c(0.1, 0.3, 0.4, 0.2))
                        simulation_points <- simulation_points + match_results
                }

                results[simulation,] <- simulation_points
        }

        return(results)
}
Then
# simulation run
simulation_results <- simulation(initial_points, remaining_games, num_simulations)
And
prob_A_team_position_1 <- sum(simulation_results[, 1] == max(simulation_results[, 1])) / num_simulations * 100
cat("A's probability to finish in 1st place:", prob_A_team_position_1, "%\n")
# P's probability to finish between 2nd and 5th place
prob_p_between_2_and_5 <- sum(simulation_results[, 5] >= max(simulation_results[, -1]) & simulation_results[, 5] < max(simulation_results[, -1])) / num_simulations * 100

cat("P's probability to finish between 2nd and 5th place:", prob_p_between_2_and_5, "%\n")
But this returns unrealistic data:
A's probability to finish in 1st place: 0.01 %
P's probability to finish between 2nd and 5th place: 0 %
