audrey
1
hello! i am working with a given line of code for a beginner's course, which says:
qplot(BOD$Time, BOD$demand, geom = "bar", stat = "identity"
but it isn't working ("identity" is a y aesthetic) , so I've been playing around with different versions including my latest one:
qplot(BOD$Time, BOD$DEMAND, aes(geom_bar(stat = "identity")))
but here, the aesthetic is the wrong length. How do I use stat and geom correctly?
audrey
2
update: after investigating further, it appears that R was updated and no longer supports that line of code. however if anyone has any insights about how to fix my graph i'd still be happy to hear them  https://www.oreilly.com/catalog/errataunconfirmed.csp?isbn=0636920023135
This has to do with a ggplot2 update, not R itself.
geom_bar with stat identity now has been replaced with just geom_col
library(ggplot2)
qplot(iris$Species, iris$Sepal.Length, geom = "col")
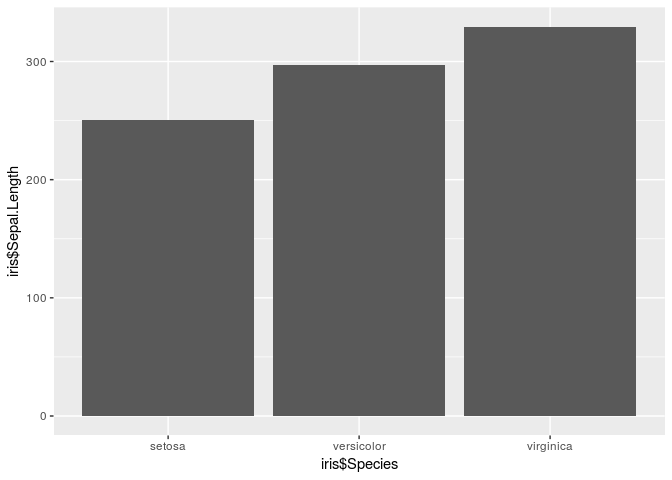
Created on 2019-02-02 by the reprex package (v0.2.1)
1 Like
system
Closed
4
This topic was automatically closed 21 days after the last reply. New replies are no longer allowed.
If you have a query related to it or one of the replies, start a new topic and refer back with a link.